








Executive summary
YouTube is a disclosed advertising business inside Alphabet, a TV-screen habit in Nielsen's monthly Gauge, and a payout machine for the creator economy. Alphabet reported $36.1 billion in YouTube advertising revenue for fiscal 2024—roughly the same order of magnitude as Netflix's $39.0 billion in total streaming revenue that year, though the two lines measure different things (auction-based ads vs subscription receipts). YouTube said in September 2025 it has paid more than $100 billion to creators, artists, and media companies over the prior four years. YouTube led Nielsen's Media Distributor Gauge with 15.8% of U.S. TV watch-time in August 2026, ahead of Disney (9.3%) and Netflix (7.7%). Nielsen's Media Distributor Gauge placed YouTube at 13.4% of U.S. television usage on TV screens in July 2025, ahead of Disney (9.4%) and Netflix (8.8%) in the same release.
The mechanism underneath those platform numbers is a revenue-share contract. Google documents a 55% partner share of net watch-page advertising revenue on long-form video; Shorts pools pay creators 45% in YouTube's published Partner Program updates. Goldman Sachs Research sized the broader creator economy at about $250 billion in 2022, projecting roughly $480 billion by 2027, with short-form ad monetization as a growth driver— including estimates that Shorts ads could rise from a low single-digit share of YouTube ad revenue toward one quarter of the total by 2027.
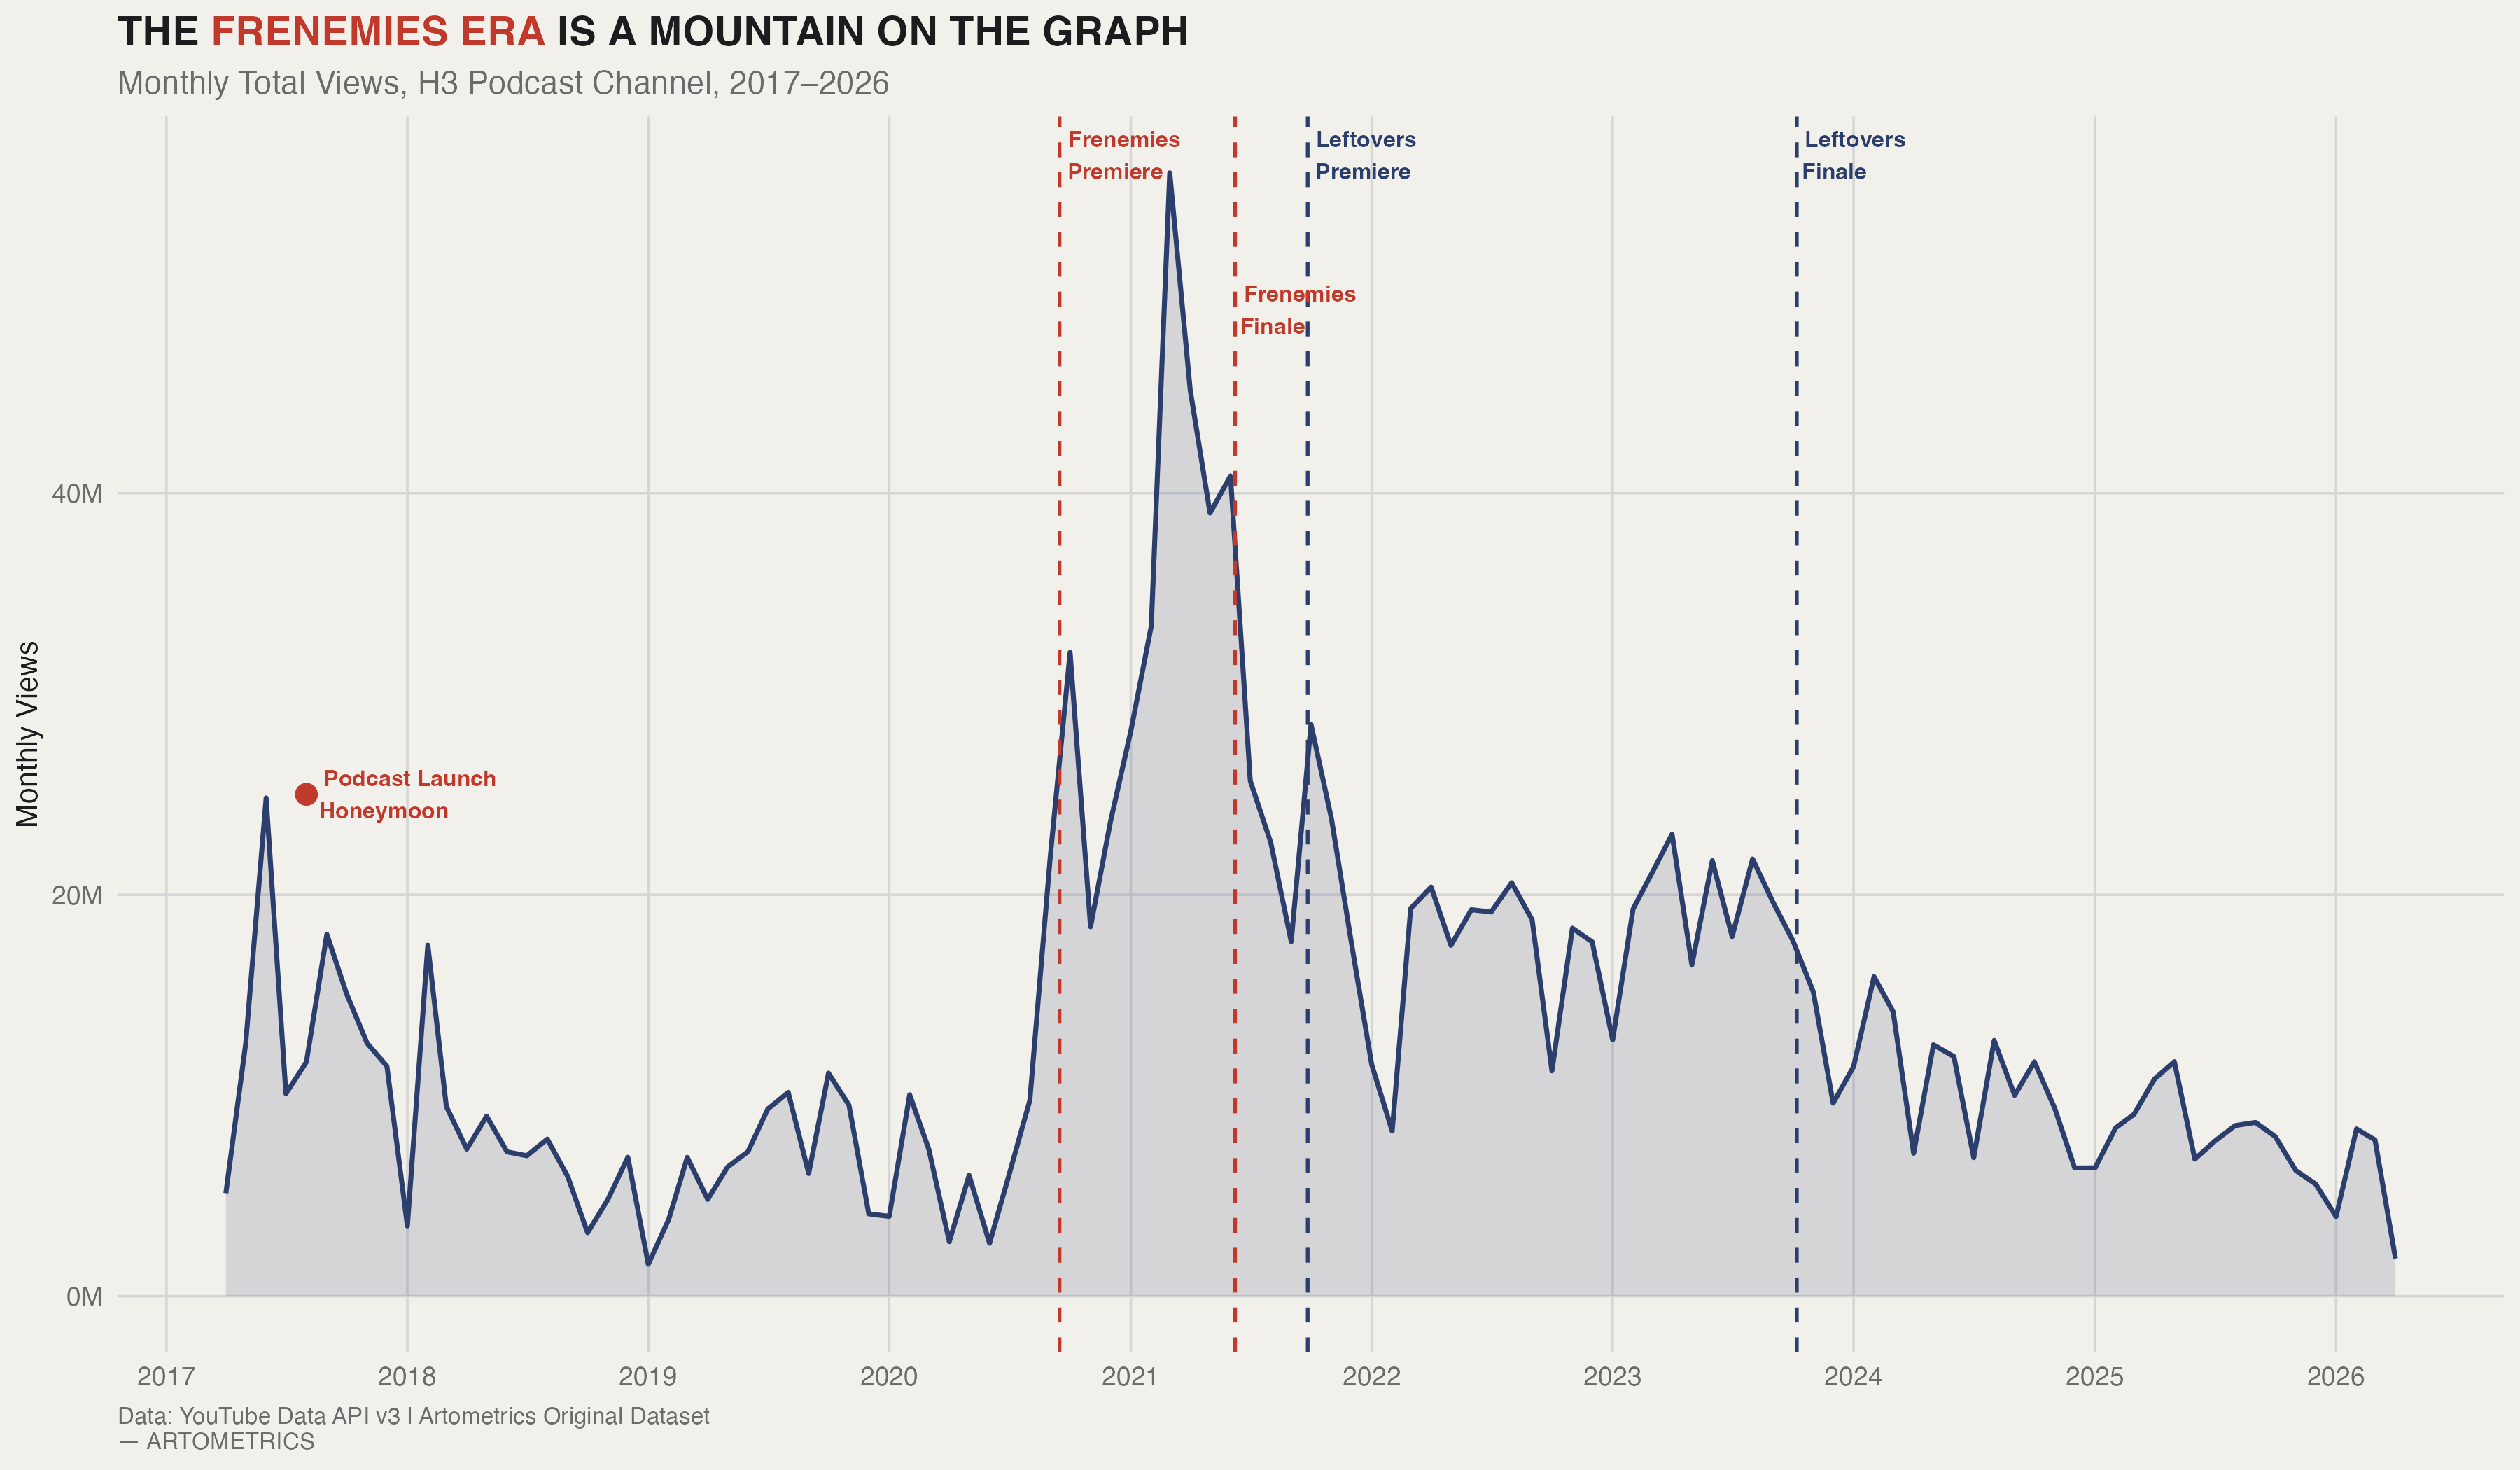
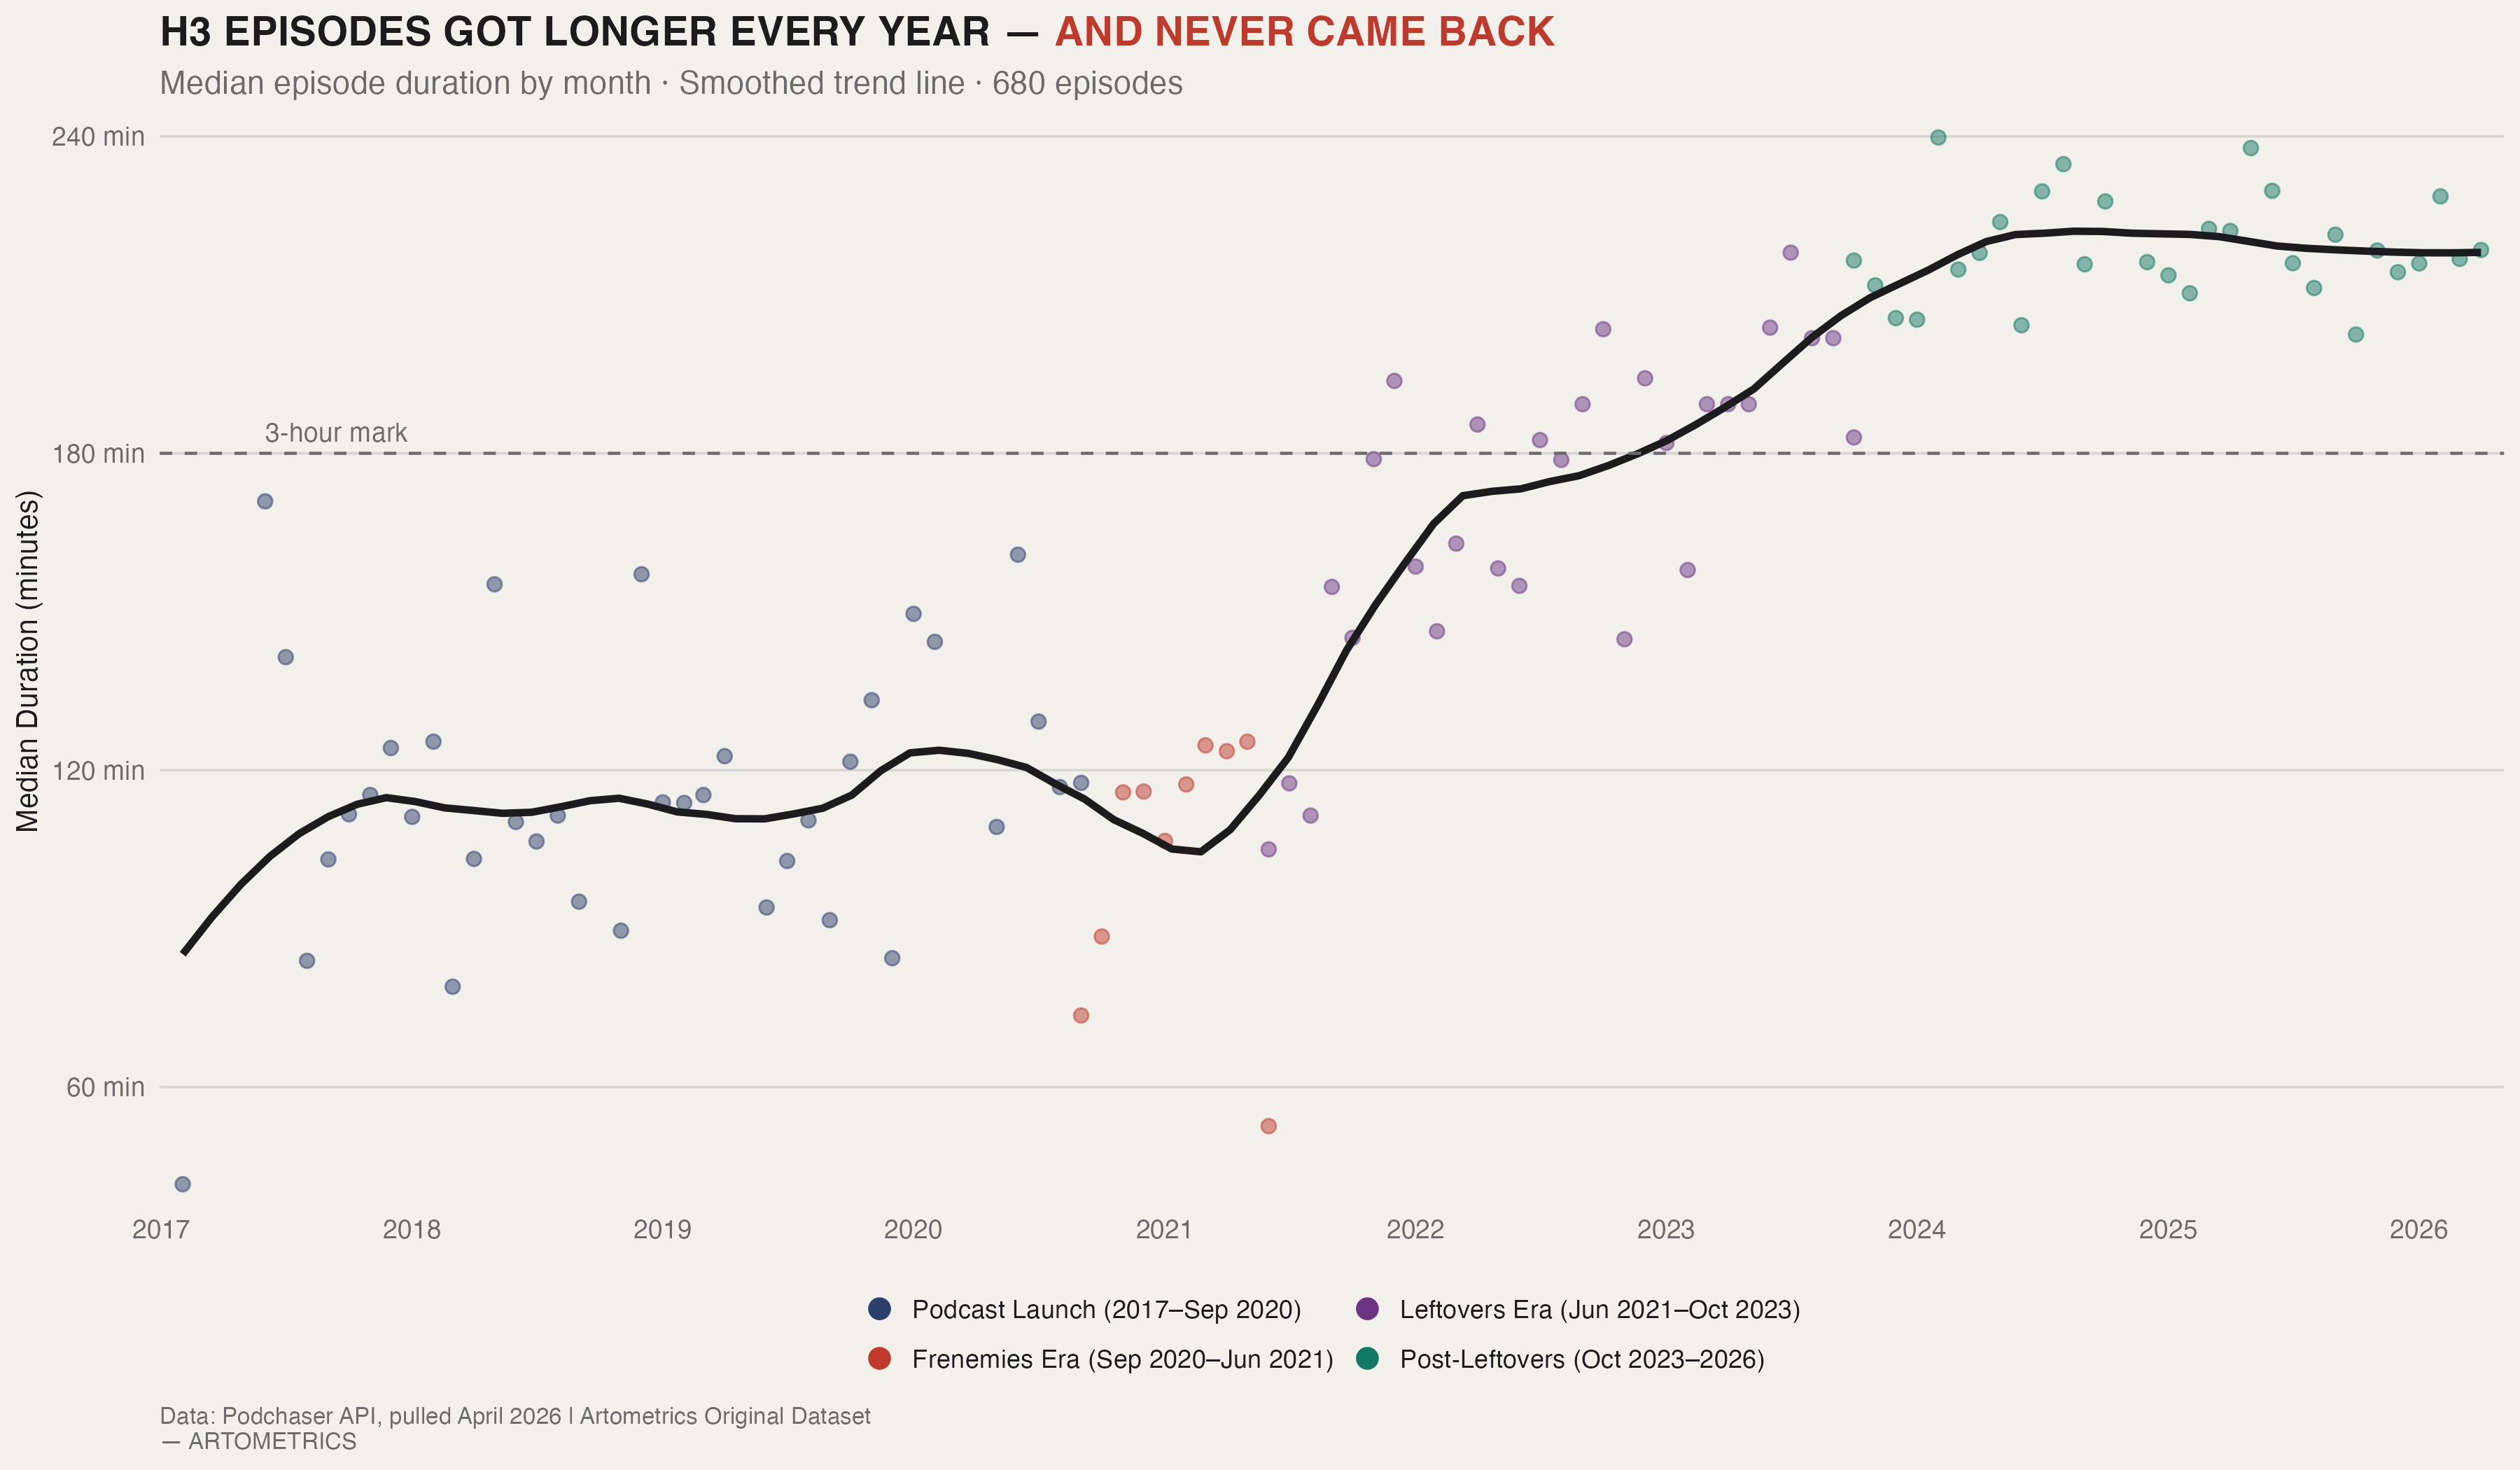
This report's case study sits inside that macro frame. The H3 Podcast's nine-month Frenemies co-host era (Ethan Klein and Trisha Paytas, September 2020–June 2021) tripled monthly channel views and established a viewership ceiling the podcast has not approached since. When the partnership ended mid-episode on camera, views reverted to baseline within a month. The show that remained is longer—220+ minute median episodes in 2024 versus 42 minutes in 2017—and smaller than the Frenemies peak. Platform economics explain why a borrowed audience matters: in a $36B ad market, missing your own peak is not necessarily failure, but it is a strategic fact.
Research question
How do disclosed YouTube platform economics (Alphabet revenue, Nielsen TV-screen share, Partner Program splits, and creator-economy scale estimates) contextualize what happens when a major podcast builds its apex around a guest co-host—and what should executives infer about durability, format length, and community risk?
Data & method (at a glance)
Platform tables — Fiscal-year YouTube ads revenue from Alphabet Form 10-K filings (2018–2024); FY2024 Netflix total revenue for scale comparison. Nielsen figures from published Media Distributor Gauge and Gauge press releases (TV-screen methodology; YouTube TV excluded). Partner splits from Google YouTube Help and YouTube Blog. Goldman Sachs creator-economy and Shorts estimates (April 2023 research; labeled projections).
H3 case study — 1,638 videos across four channels (YouTube Data API v3, April 2026), 680 podcast episodes with duration (Podchaser), Reddit monthly post counts (Arctic Shift: r/h3h3productions, r/h3snark). Era labels are editorial (Baseline, Frenemies, Leftovers, post-2023).
Charts — Seven economics figures built from committed CSVs in articles/youtube/data/ via npm run brief:youtube; three H3 figures from the Artometrics h3 repository pipeline.
YouTube ads crossed $36B
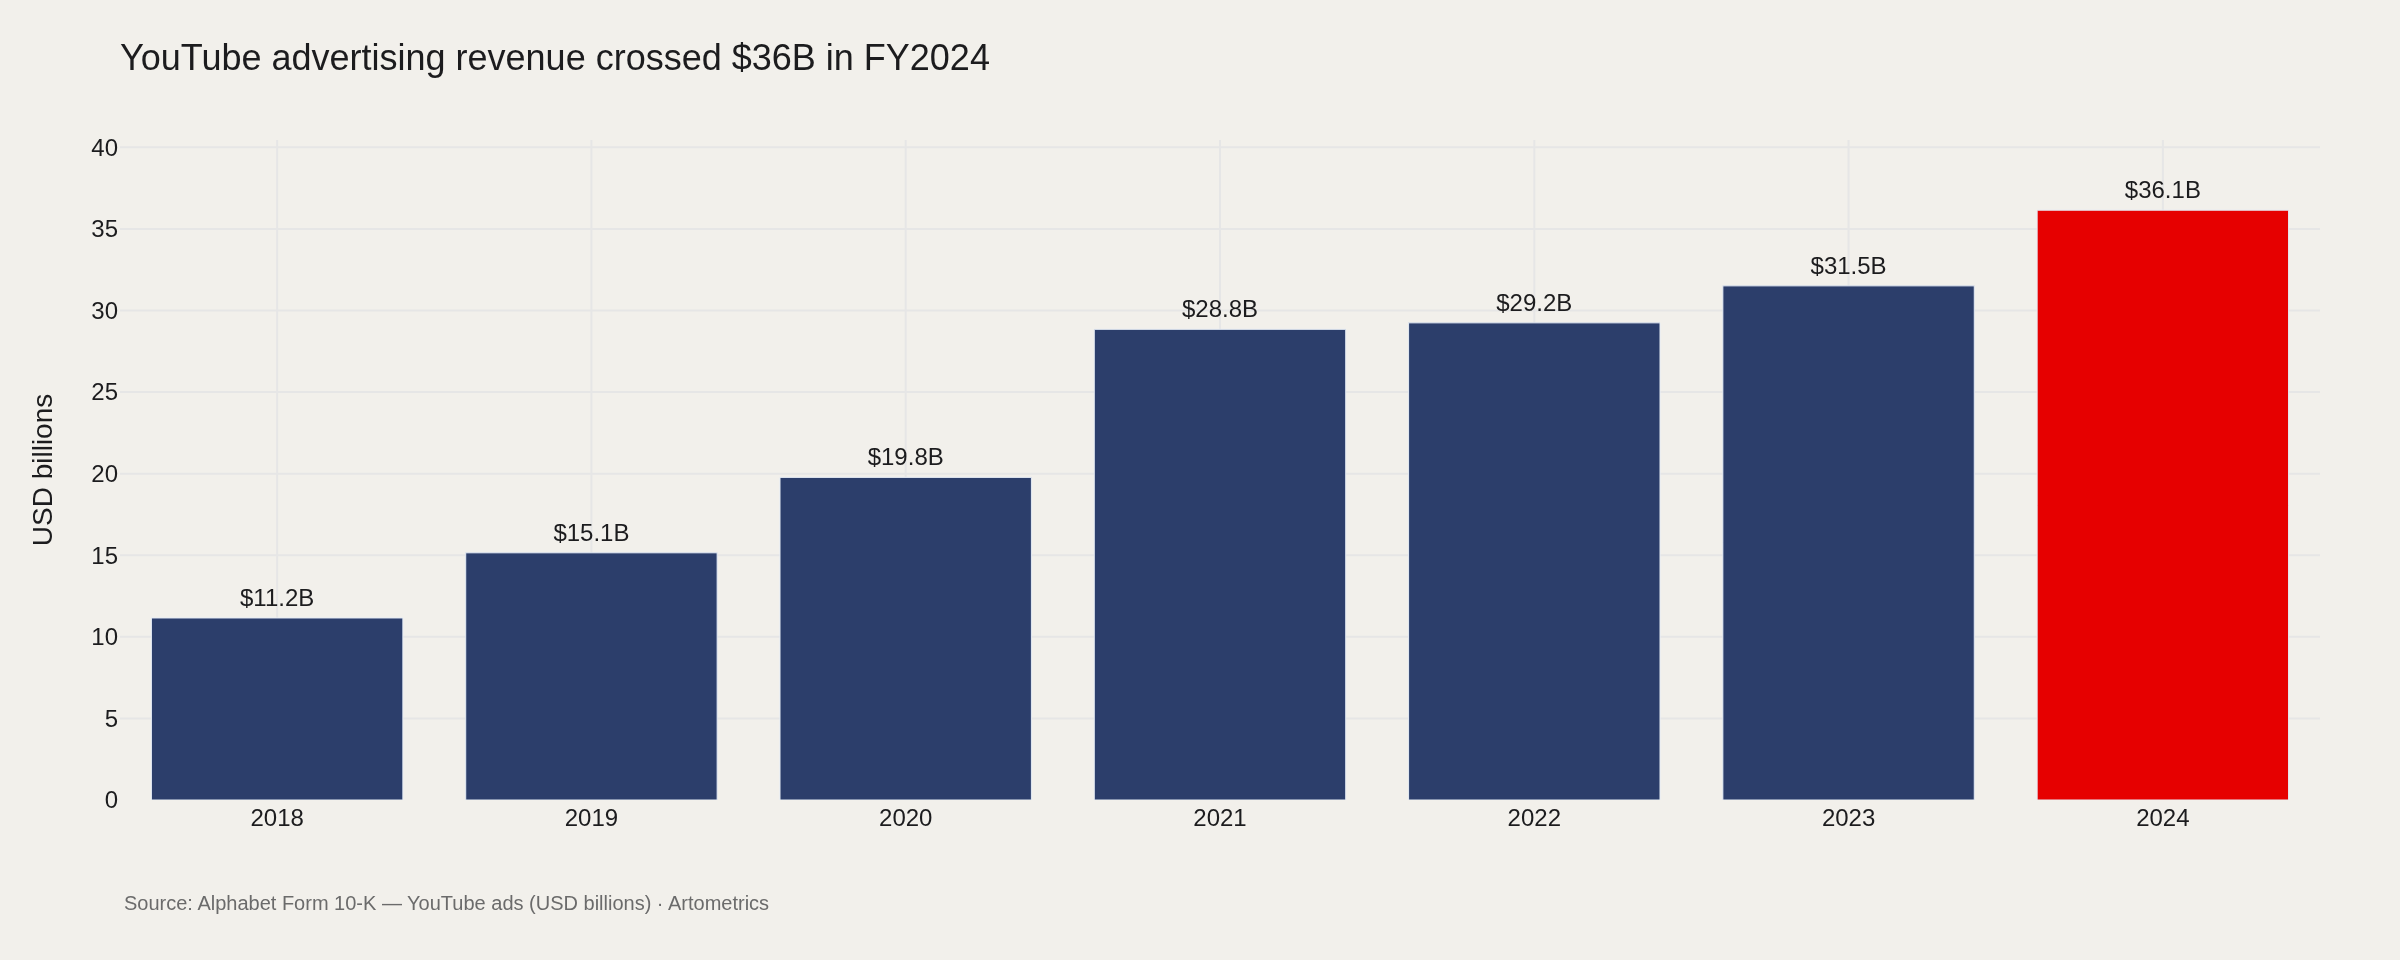
What it means. YouTube is material to Alphabet—not a rounding error inside Google Services. The filing line is narrow (advertising on YouTube properties) and excludes subscription products such as YouTube Premium, YouTube TV, and NFL Sunday Ticket, which Alphabet reports elsewhere.
How we know. Alphabet disaggregates "YouTube ads" in annual 10-K revenue tables. FY2024 reports $36,147 million; FY2022's slowdown to $29.2 billion (+1.4% year over year) preceded re-acceleration to $31.5 billion (FY2023) and $36.1 billion (FY2024).
What explains it. Watch-time growth on connected TVs, brand and direct-response demand, and Shorts feed inventory all sit behind the headline. Cyclical ad markets show up in the 2022 plateau; the 2024 step-up aligns with YouTube's TV-screen share gains in Nielsen (below).
Scale check: Netflix subscriptions
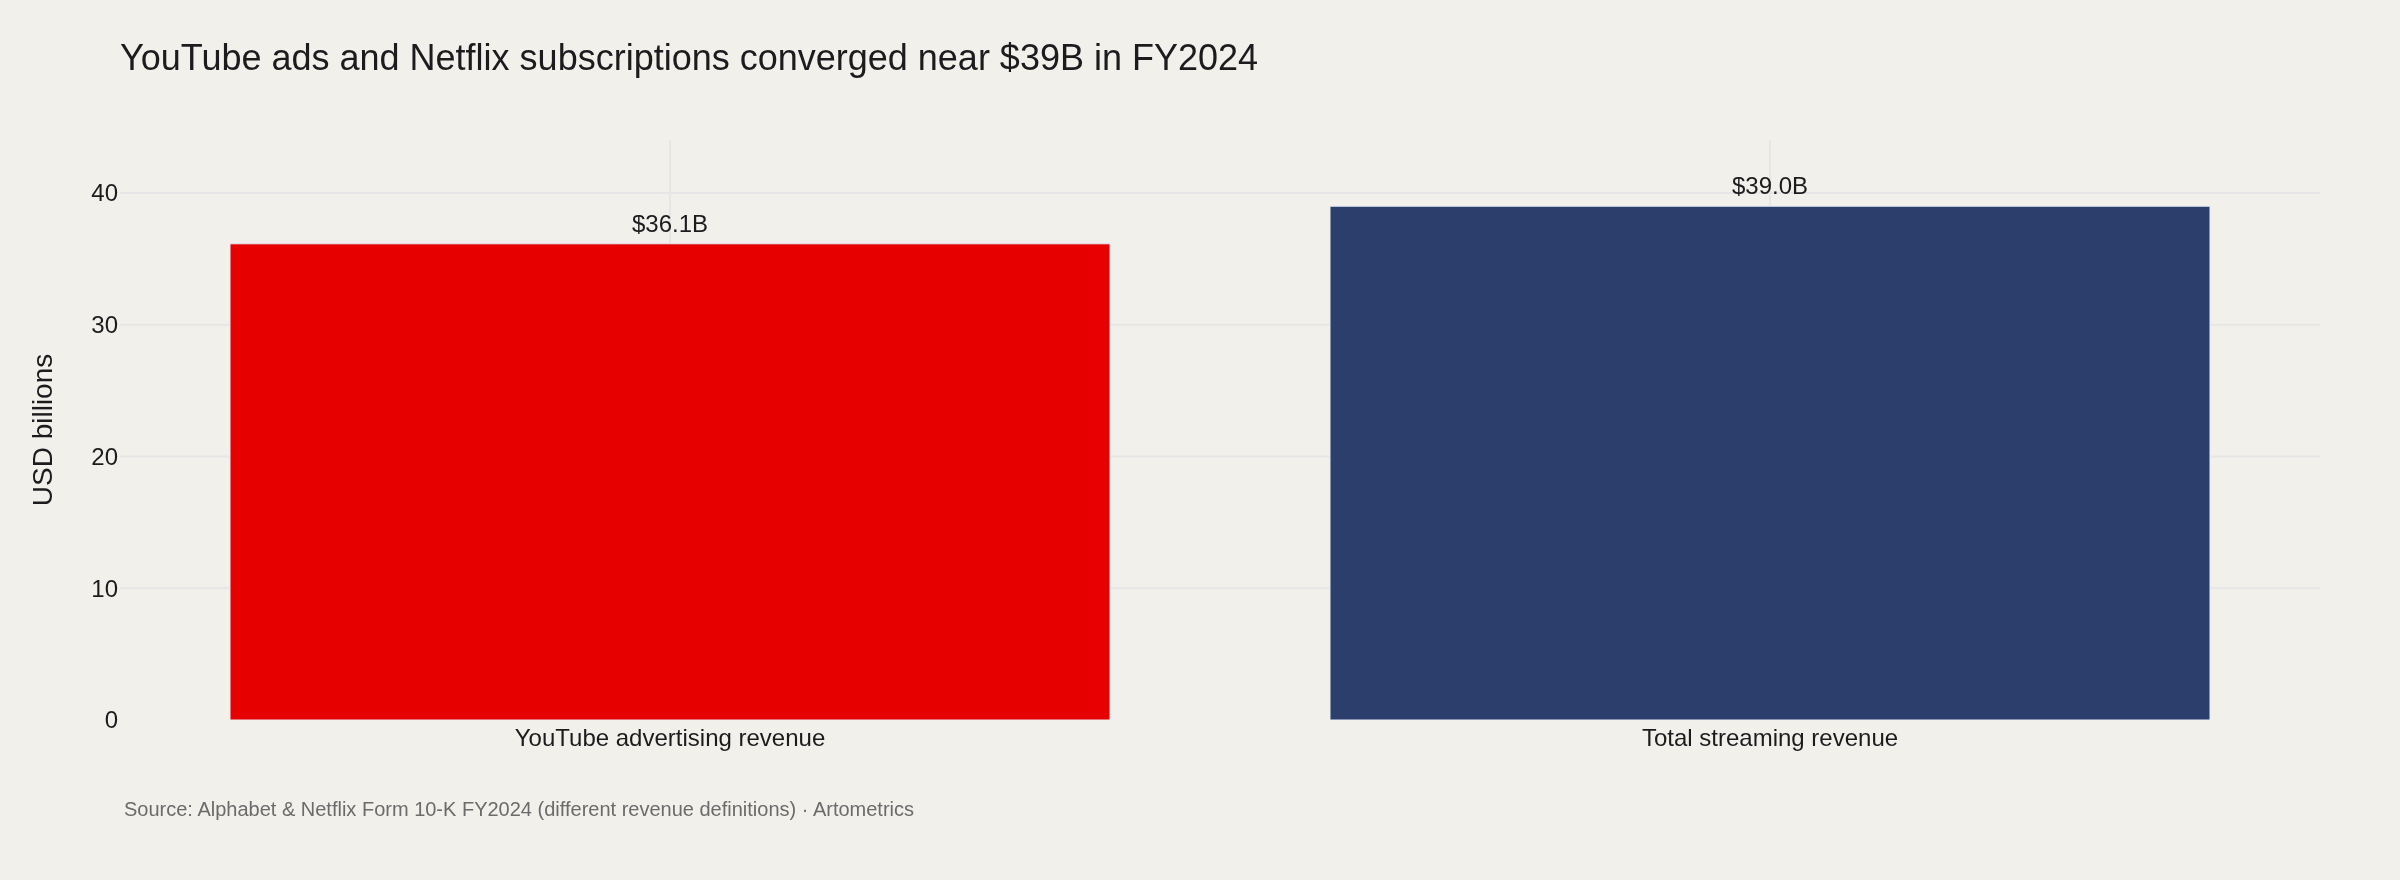
Netflix reported $39.0 billion in total revenue for the year ended December 31, 2024. Comparing that to YouTube's $36.1 billion in ads only is imperfect—Netflix is mostly membership fees; YouTube also earns subscriptions and commerce—but it frames how large the ad line has become relative to a pure-play streamer.
TV-screen share is now a lead indicator
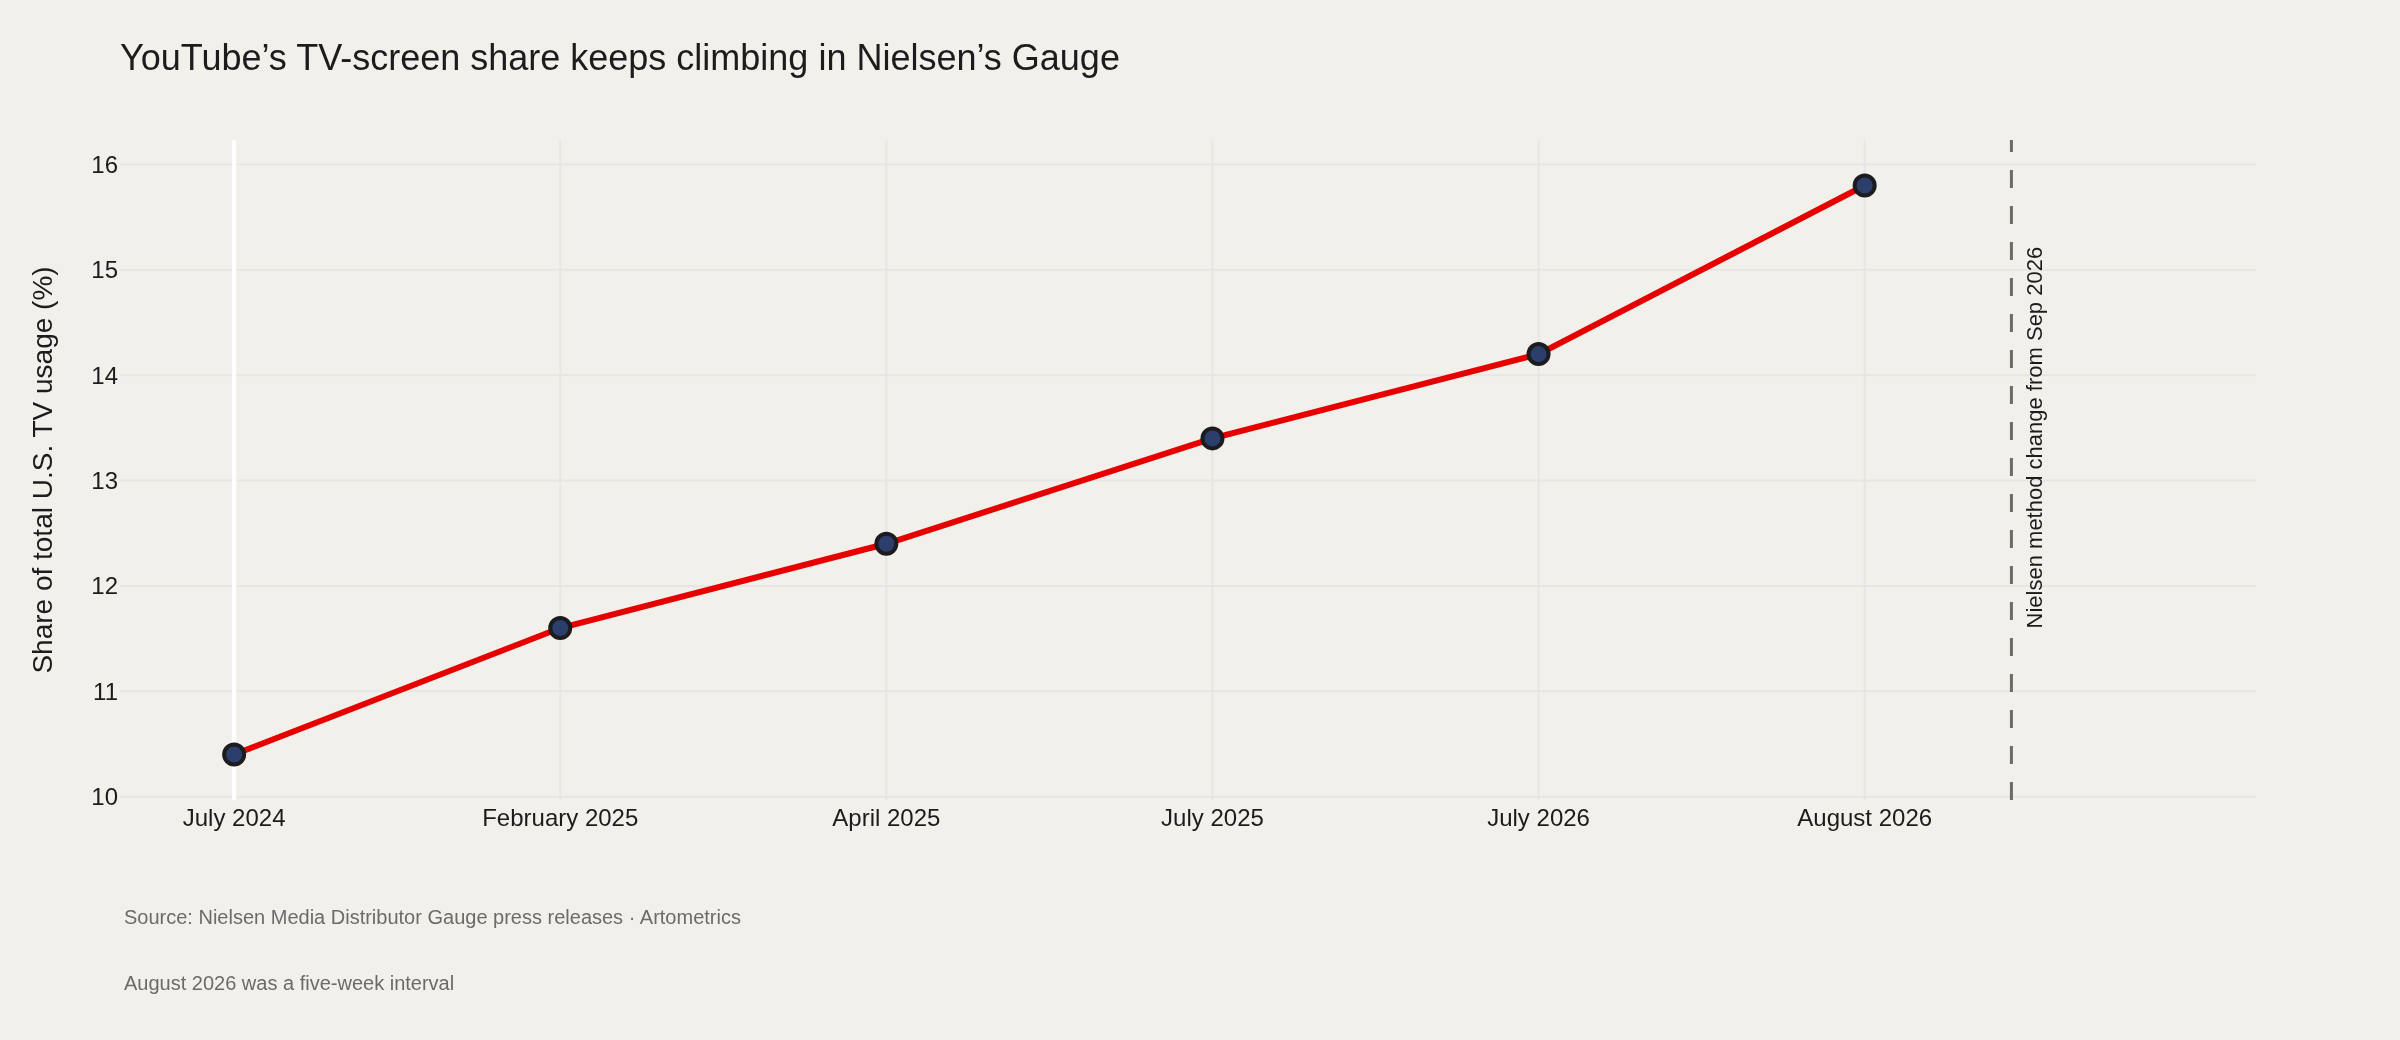
What it means. YouTube competes for living-room attention with Disney, Netflix, and linear bundles—not only for mobile minutes. Nielsen's Media Distributor Gauge ranks media companies by share of time spent watching television; YouTube led in multiple 2024–2025 months.
How we know. Nielsen press releases document month-level shares. The February 2025 release notes YouTube usage in The Gauge excludes viewing on YouTube TV (the pay-TV bundle). Methodology is TV-screen only; mobile and desktop are out of scope.
What explains it. Connected-TV apps, lean-back podcast and commentary formats, and kids' summer viewing (Nielsen highlighted school-aged viewers in July 2024) all push YouTube onto the set. For long-form creators such as H3, that shift matters: episodes that already run hours are competing in the same clock as scripted series.
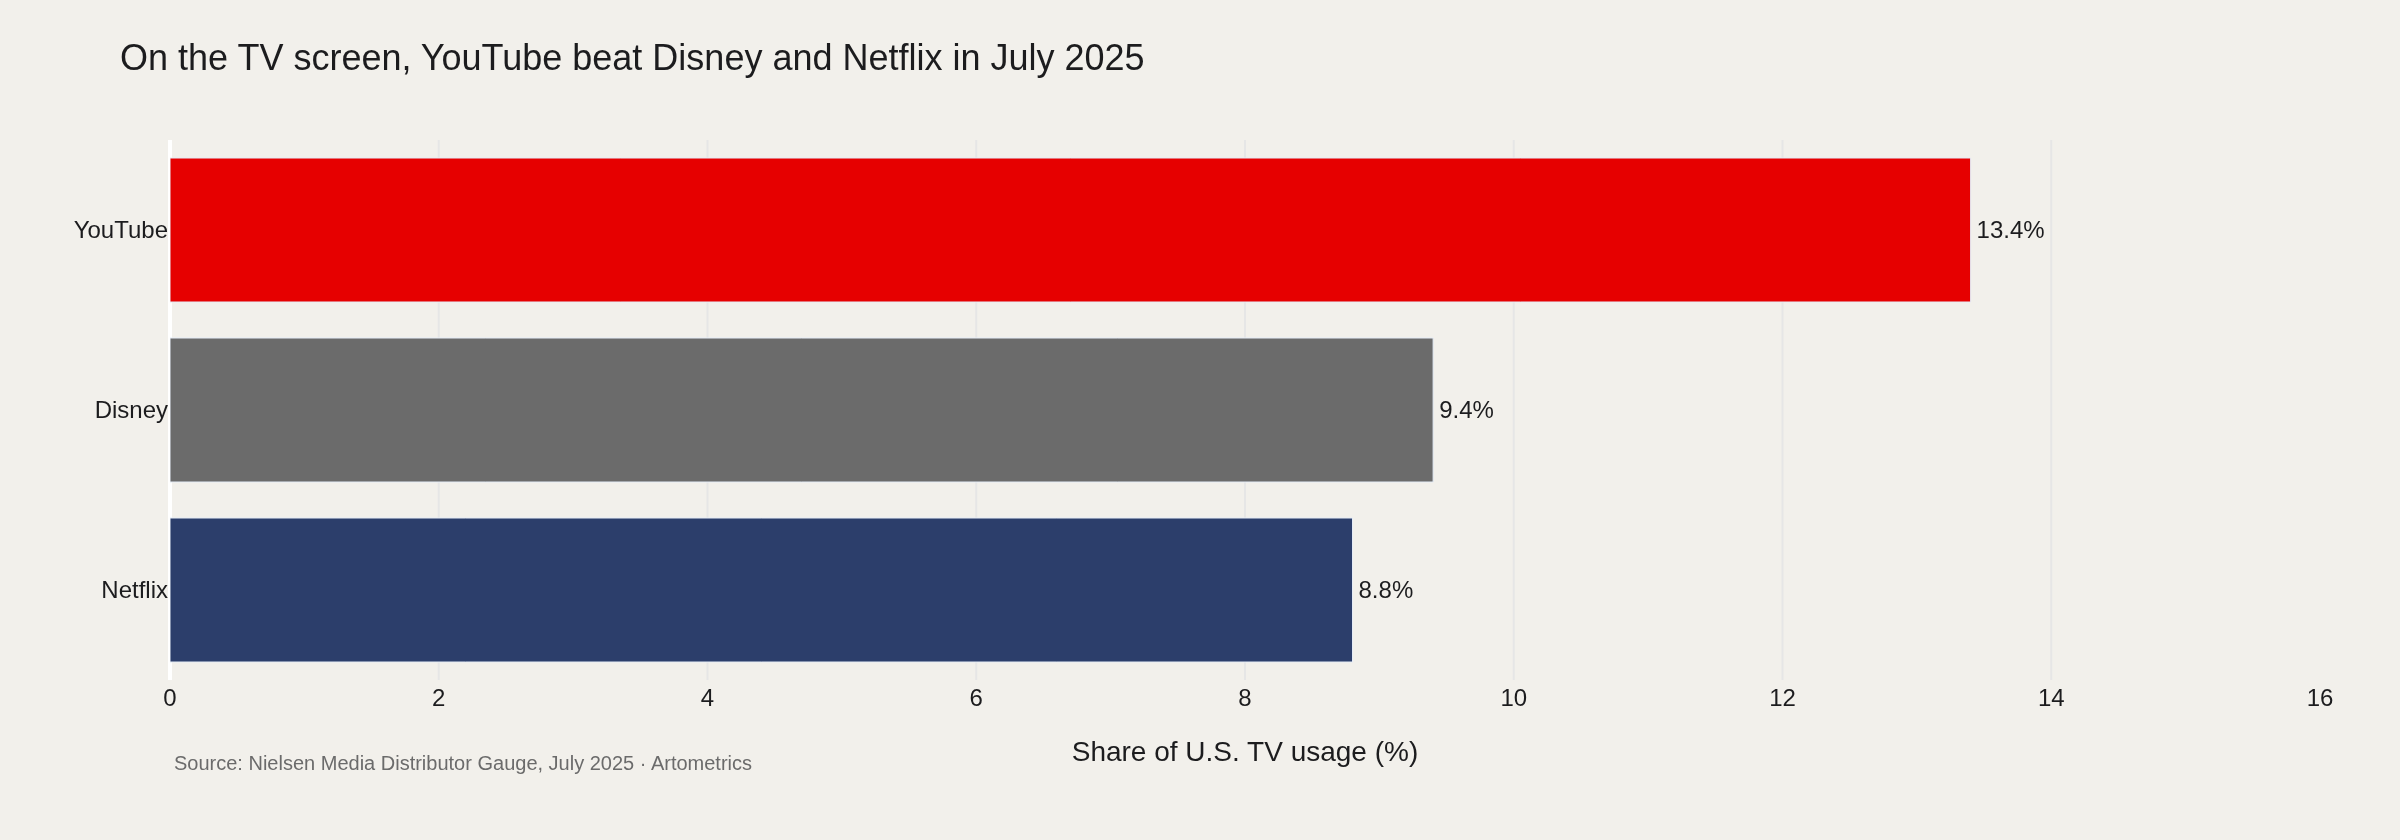
Linear television still accounts for the majority of TV-screen time when broadcast and cable are combined—Nielsen reported streaming at 44.3% of total TV in April 2025, implying the remainder is broadcast and cable. YouTube's rise is therefore a share shift inside a shrinking linear base, not proof that mobile viewing disappeared.
Creator payouts and the Partner Program split
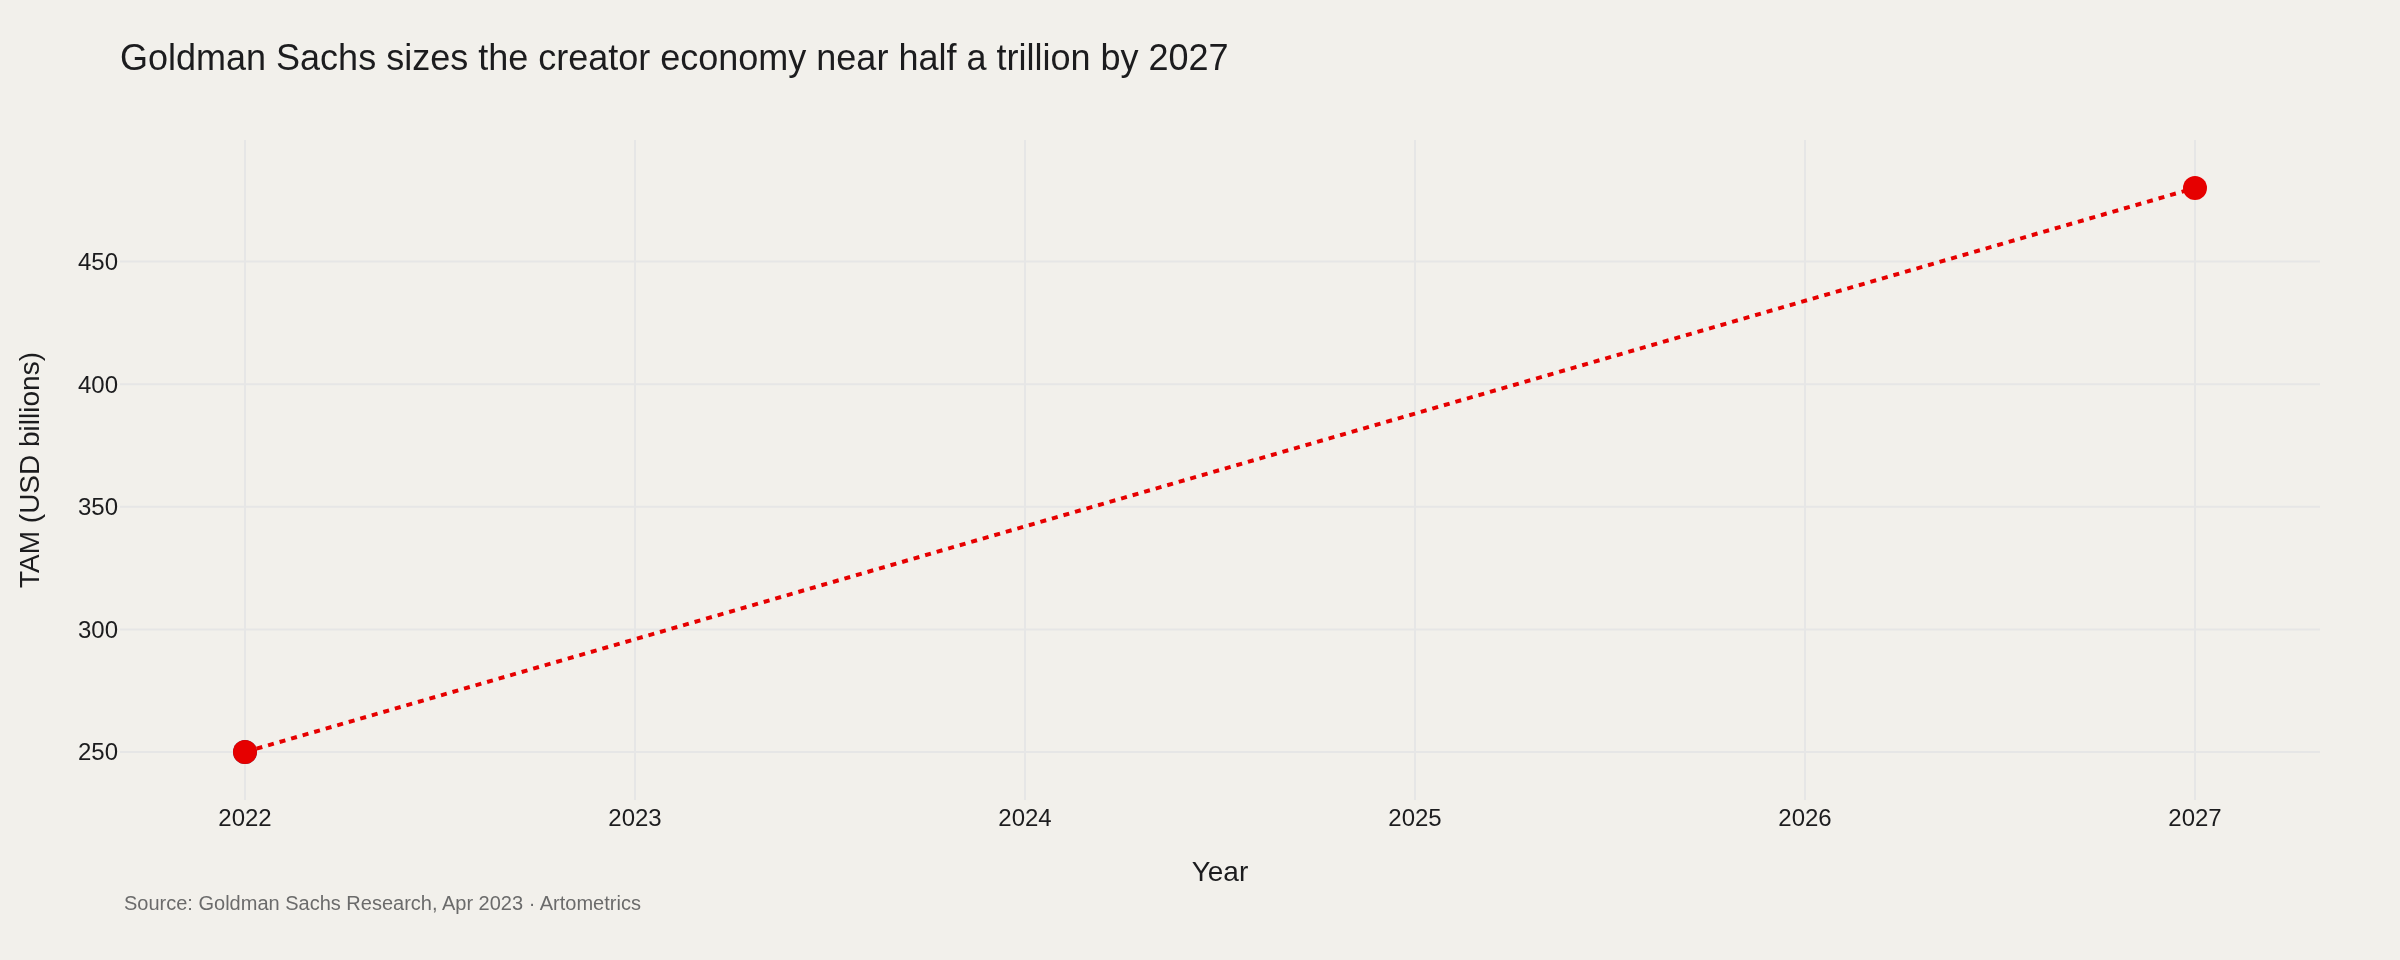
YouTube's September 2025 Made on YouTube announcement said the platform paid out over $100 billion to creators, artists, and media companies globally over the last four years. CNBC reported the same figure and noted CEO Neal Mohan had cited $70 billion paid between 2021 and 2024 a year earlier—suggesting accelerating payouts, not a flat run rate. These are company statements, not independently audited splits by creator tier.
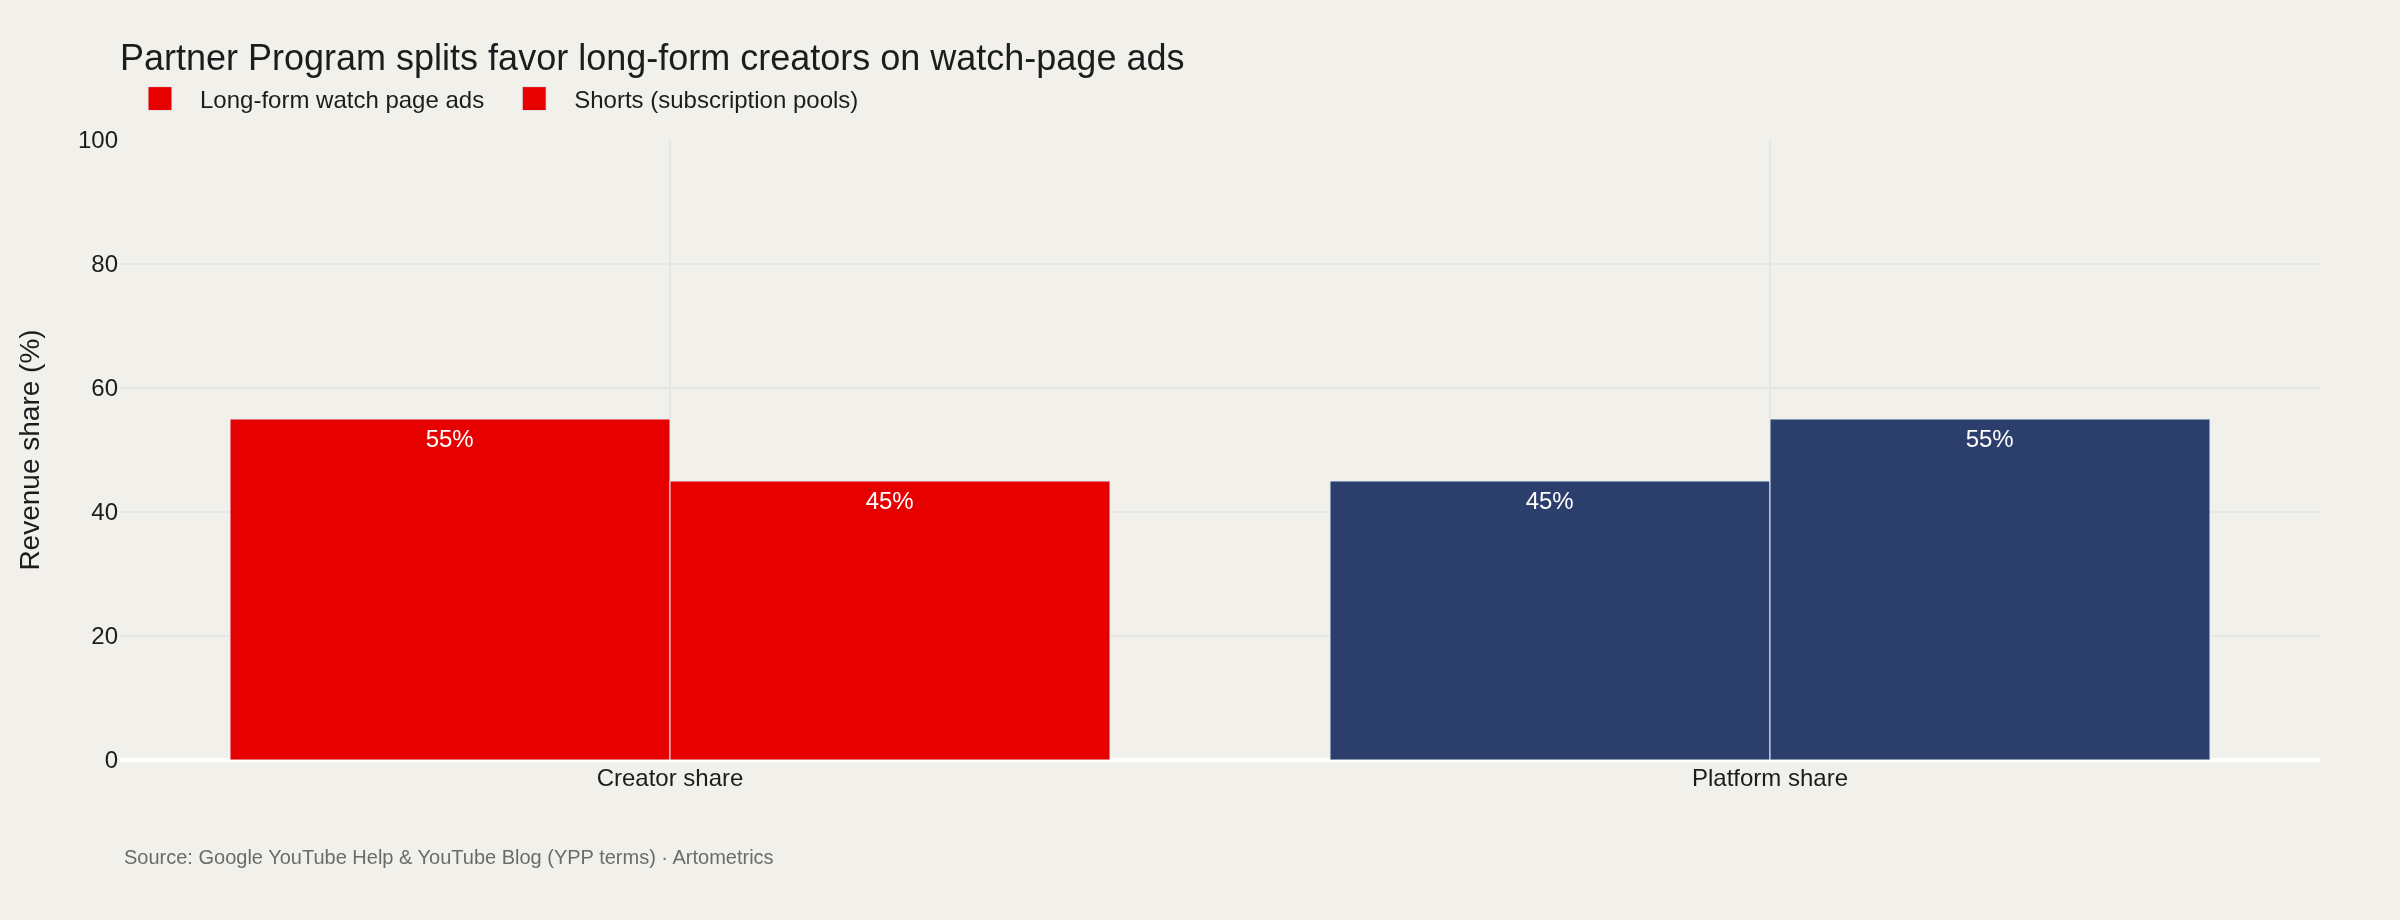
Mechanism. Watch-page ads pay creators 55% of net revenue when the Watch Page Monetization Module is accepted (Google YouTube Help). Shorts draws from subscription revenue pools with a documented 45% creator share in YouTube's Partner Program update posts. Music-licensing modules can reduce the effective long-form share when eligible tracks are used.
Implication for H3. A three-hour podcast episode monetized on watch-page ads shares roughly half of marginal ad dollars with Google; the other half funds platform R&D, sales, and content ID. When views fall 70% from a co-host peak, both halves shrink—even if loyal fans watch longer.
Shorts vs long-form economics
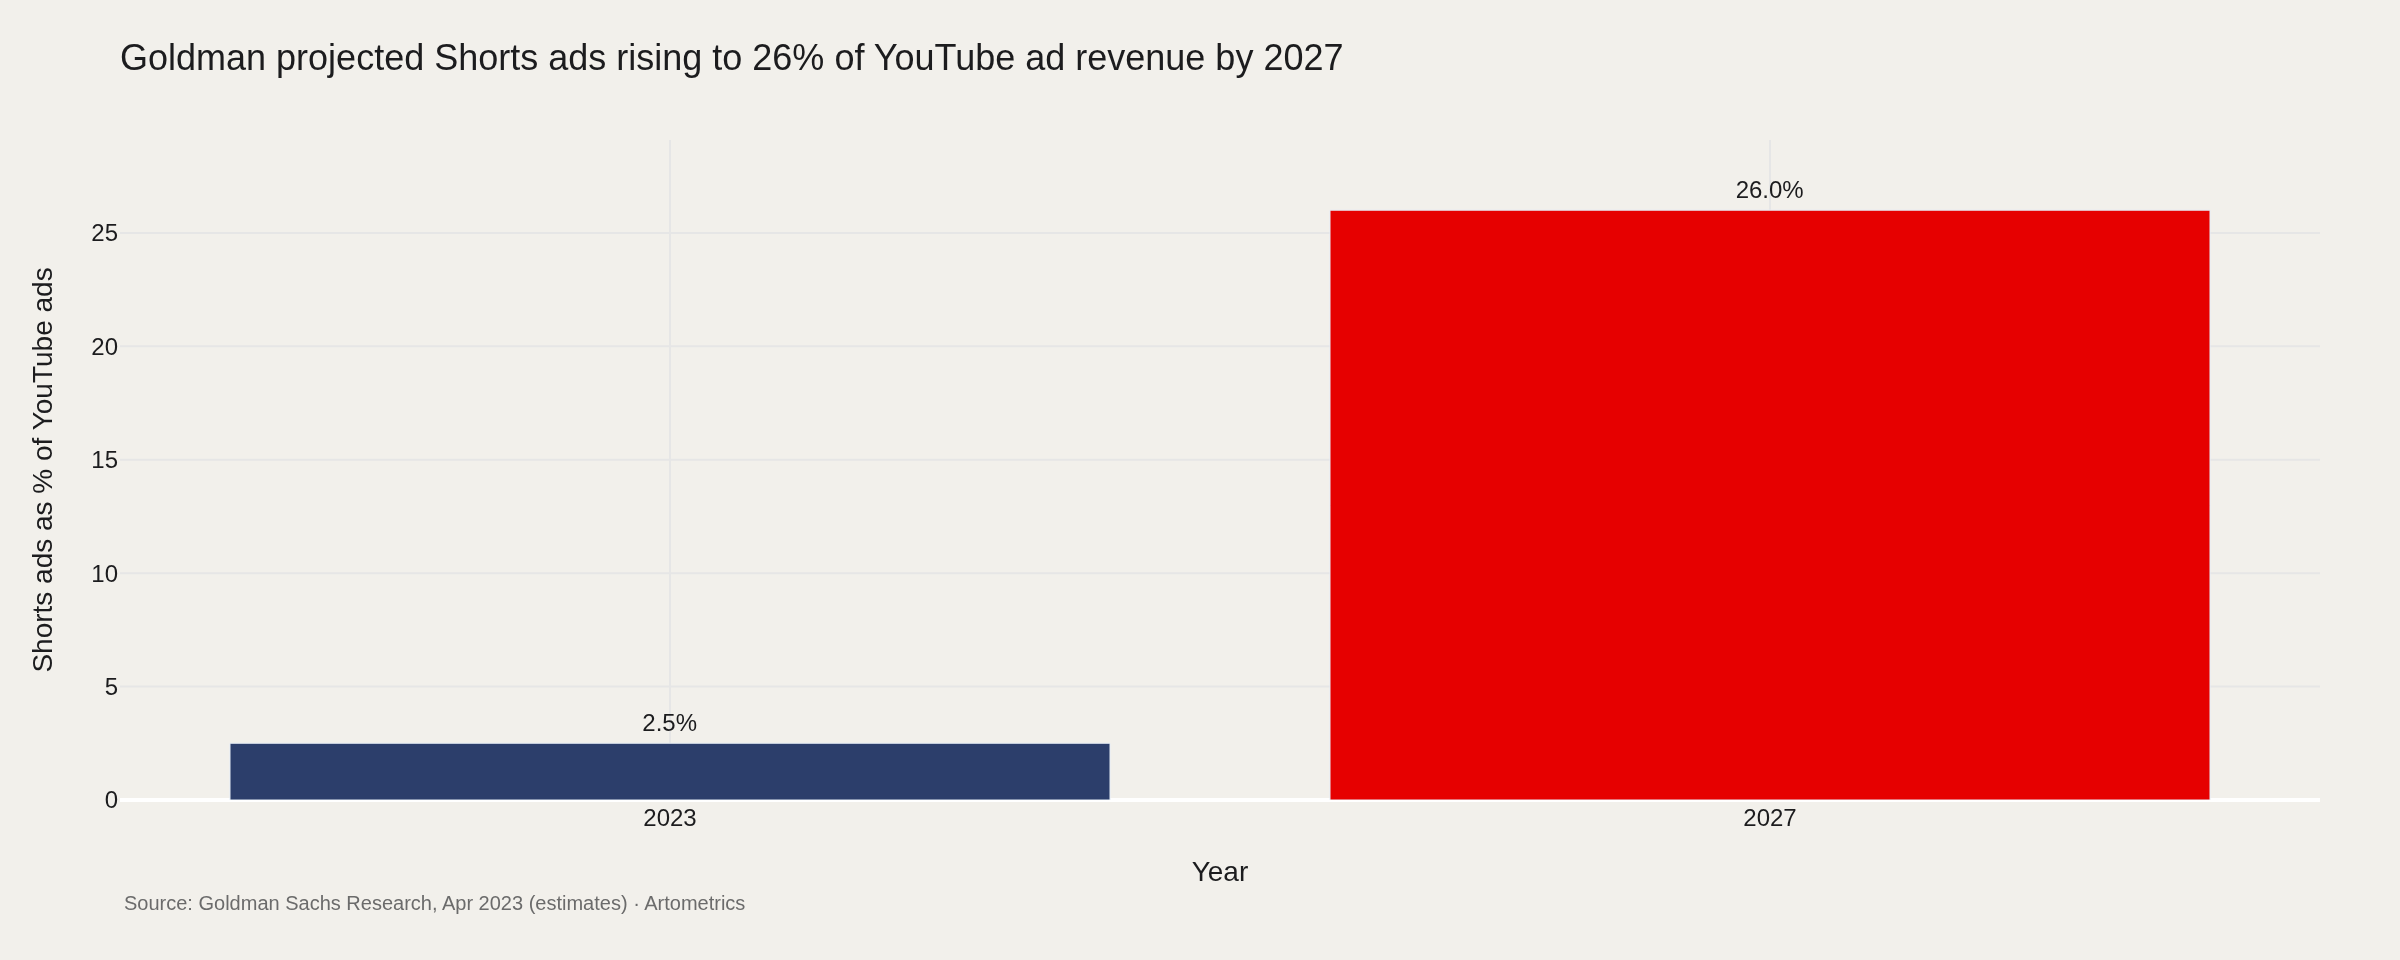
Shorts is structurally different: lower creator share, feed-based discovery, and CPMs that creators often report as below long-form. Goldman Sachs modeled Shorts advertising rising from about $750 million (2.5% of YouTube ads) in 2023 to about $11.6 billion (26%) in 2027. Alphabet does not publish Shorts revenue separately; treat this as analyst scenario planning.
H3's dataset filters Shorts out of the 1,876-video pull; the case study is intentionally long-form. That choice matches the show's economic model (mid-roll ads on marathon podcasts) but understates how younger cohorts enter the fandom via clips.
Cross-market comparisons
TikTok. ByteDance does not publish U.S. TikTok revenue in SEC filings. Goldman Sachs' 2025 creator-economy framing cites third-party estimates of U.S. creator sponsored-content revenue by platform (YouTube largest in their exhibit table) but not TikTok corporate revenue. Regulatory risk (potential ban scenarios) appears in the same research as a reallocation story toward Meta and Google video products—useful strategically, not a clean revenue benchmark.
Twitch. Amazon does not break out Twitch advertising and subscriptions in enough detail for a peer chart beside YouTube ads. Twitch remains the reference for live tipping and sub splits; YouTube has pushed live and gifting, but disclosure stays aggregated inside Google Services.
Linear TV. Nielsen's April 2025 Gauge shows streaming at 44.3% of TV usage, with broadcast and cable down year over year. YouTube's 13.4% TV-screen share in July 2025 is not 13.4% of all video everywhere—it is share of the TV glass in the U.S.
Neal Mohan — platform CEO
YouTube CEO Neal Mohan's 2026 priorities letter (January 2026) emphasizes creators as "the entertainment industry's new studios," AI creation tools, and commerce—consistent with diversifying beyond watch-page ads. The $100B payout headline is as much investor relations as sociology; it anchors YouTube against TikTok's cultural pull.
Case study: H3's borrowed peak
Ethan Klein and Hila Klein built h3h3productions on reaction commentary and Fair Use litigation visibility; the H3 Podcast (2017–) became the family's weekly long-form vehicle. Trisha Paytas joined as co-host for Frenemies in September 2020. Monthly H3 Podcast views roughly tripled against the pre-2020 baseline and collapsed within a month of the June 2021 on-camera breakup. Hasan Piker's Leftovers (2021–2023) produced a secondary bump, not a new peak. Post-2023, output is sparser and longer.
Ethan Klein & Trisha Paytas
Frenemies worked because two audiences overlapped: H3's commentary core and Paytas's reality-TV and YouTube-native fandom. Drama was content. When the partnership ended during episode 39, the overlap dissolved—views tracked the audience that was there for Trisha, not the brand that hosted her.
Across four channels, the network totals 3.24B lifetime views in the April 2026 pull—dominated by h3h3productions median views per video (4.78M) versus H3 Podcast (1.05M). The podcast is the weekly habit; the flagship channel is the archive that still monetizes via recommendations.
Counterexamples
Guest-forward shows that survived turnover. Hot Ones (First We Feast) rotates guests while growing brand value—the product is the format, not one co-host dyad. H3 inverted that: Frenemies was structurally dependent on Paytas's participation.
MrBeast scale. Jimmy Donaldson's main channel operates at orders-of-magnitude higher per-video reach than H3 Podcast; YouTube's TV-screen growth rewards spectacle and rewatches. The comparison is not "better content"—it is different capital intensity and advertiser appeal.
Channels that leaned into Shorts. Many news and commentary publishers used Shorts for discovery while keeping mid-roll long-form as the margin engine. H3's filtered dataset de-emphasizes that path; a Shorts-first strategy might have cushioned the Frenemies drop but would change the CPM mix (45% Shorts pool vs 55% watch-page).
H3 did not collapse. Post-peak H3 Podcast still clears millions of monthly views—correction, not extinction. In a platform paying $100B+ to creators, mid-tier loyalty can still fund a staff; it cannot fund a peak built on someone else's fanbase.
Decision tools for executives
| If you are… | Watch this metric | Threshold / benchmark | Action |
|---|---|---|---|
| AVOD platform strategist | Alphabet "YouTube ads" YoY growth vs streaming TV ad market | FY2024 +14.7% YoY on $36.1B base | Model CTV inventory as part of national video plans, not only digital extensions. |
| Creator-network operator | Co-host / guest contribution to monthly views | H3: ~3× lift with Paytas; ~1× within 30 days after exit | Contract co-hosts with explicit renewal and audience overlap tests; do not book peak revenue as run-rate. |
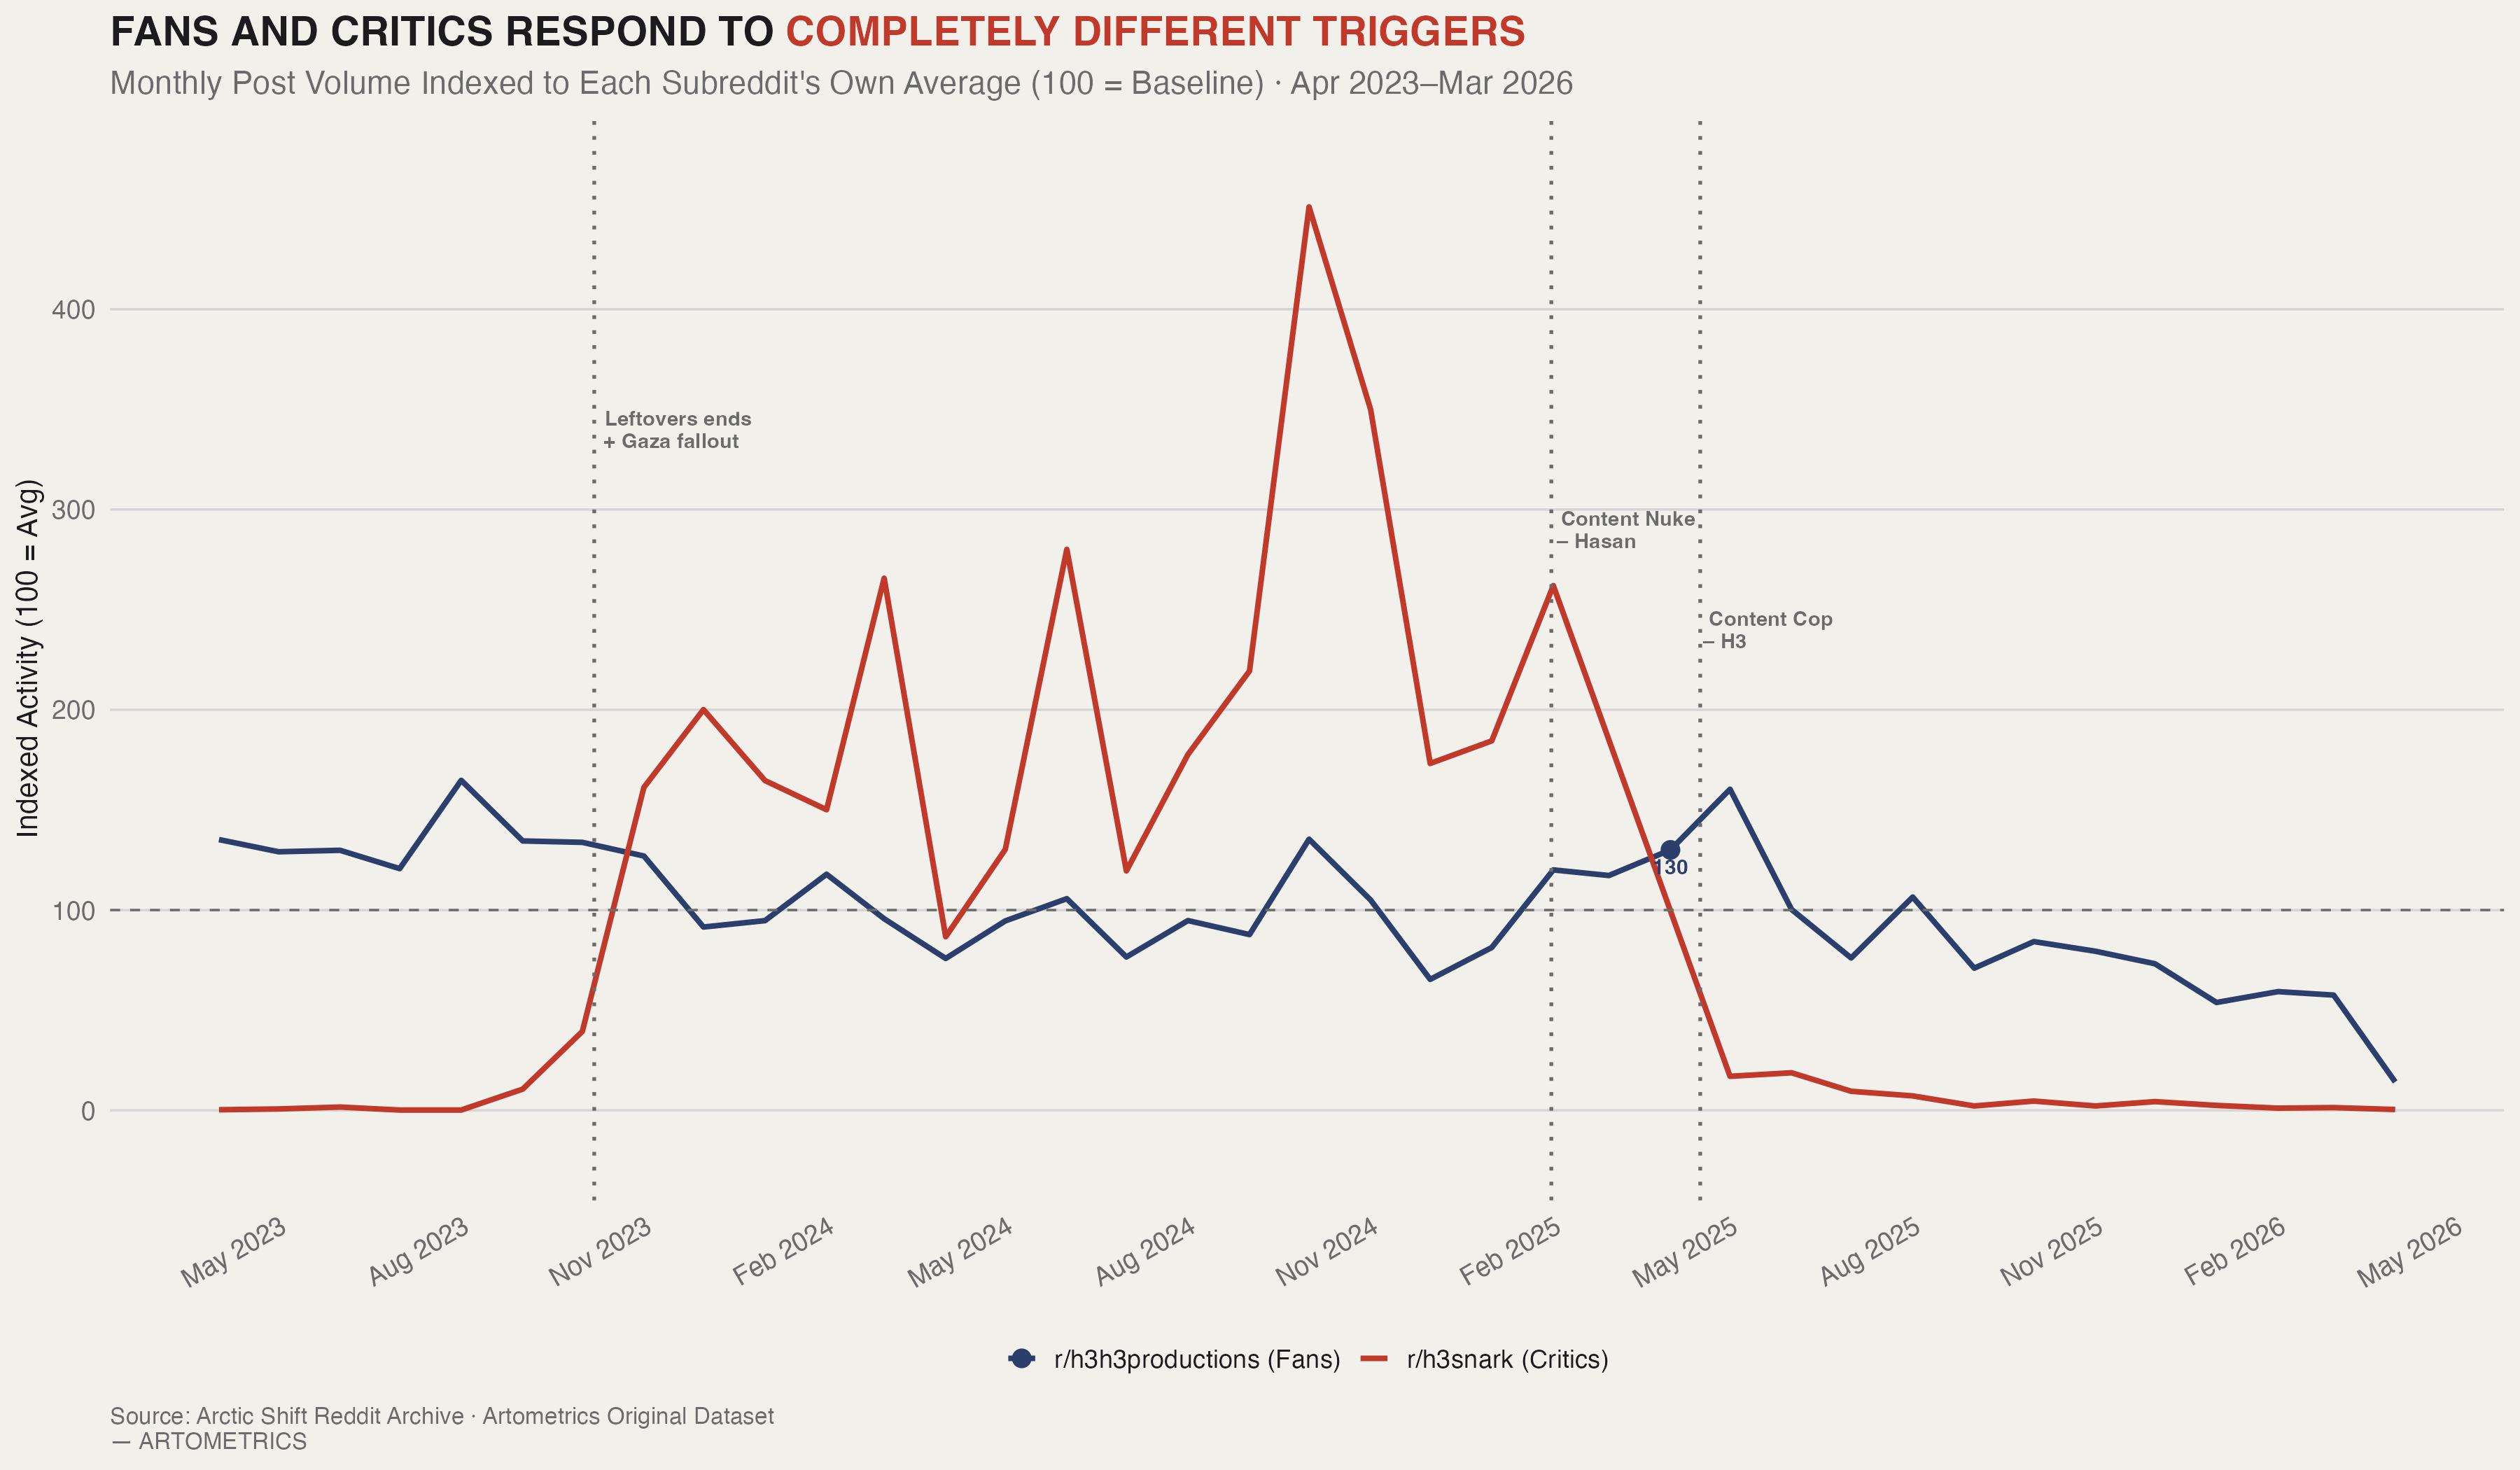
| Brand safety & community lead | Indexed critic vs fan community activity | r/h3snark 3.5× baseline on Content Cop (Apr 2025) | Separate crisis comms (critics) from retention (fans); legal takedowns suppress signal, not sentiment. |
| Format producer | Median episode duration vs return viewers | H3: 42 min → 220 min median (2017–2024) | Test whether length is loyalty or barrier; TV-screen share rewards lean-back, not infinite grind by default. |
Limitations
Alphabet reports YouTube ads, not creator margin by channel. Nielsen's Gauge is U.S.-only and TV-screen-based. Goldman Sachs Shorts figures are estimates. H3 view counts are lifetime totals as of April 2026, biased upward for older uploads. Reddit archives miss deletions; r/h3snark history starts April 2023. Podchaser durations may misclassify live streams. Frenemies episode numbering in titles is inconsistent—era labels are editorial.
Conclusion
YouTube's disclosed economics are those of a major media company: $36.1 billion in FY2024 ads, TV-screen leadership in Nielsen's Gauge months through August 2026, and $100 billion plus paid to creators over four years per YouTube's 2025 statement. The Partner Program still allocates 55% of watch-page ad net revenue to creators on long-form video—while Shorts and music modules complicate the effective rate.
Inside that machine, H3 Podcast shows the micro story: a nine-month co-host peak that tripled views and became a ceiling; a format that lengthened as the audience narrowed; critic communities that spike on scandal while fan communities erode slowly. Platform growth does not rescue a brand from its own borrowed audience. It only raises the stakes for getting the next partnership right.
Data, methods & sources
Data and method
Economics tables live in articles/youtube/data/ with licence notes in SOURCE.txt. Charts regenerate via npm run brief:youtube. H3 pipeline: github.com/Artometrics/h3 (YouTube Data API v3, Podchaser API v1, Arctic Shift Reddit). Image credits: articles/youtube/CREDITS.md. Bibliography: articles/youtube/references.bib.
References
Editor's note
This R2 report was researched and drafted in collaboration between Artometrics editorial and Claude (Anthropic). Platform figures trace to SEC filings, Nielsen releases, Google/YouTube documentation, and Goldman Sachs research as cited. H3 metrics reproduce the Artometrics open dataset.
— Artometrics Editorial