
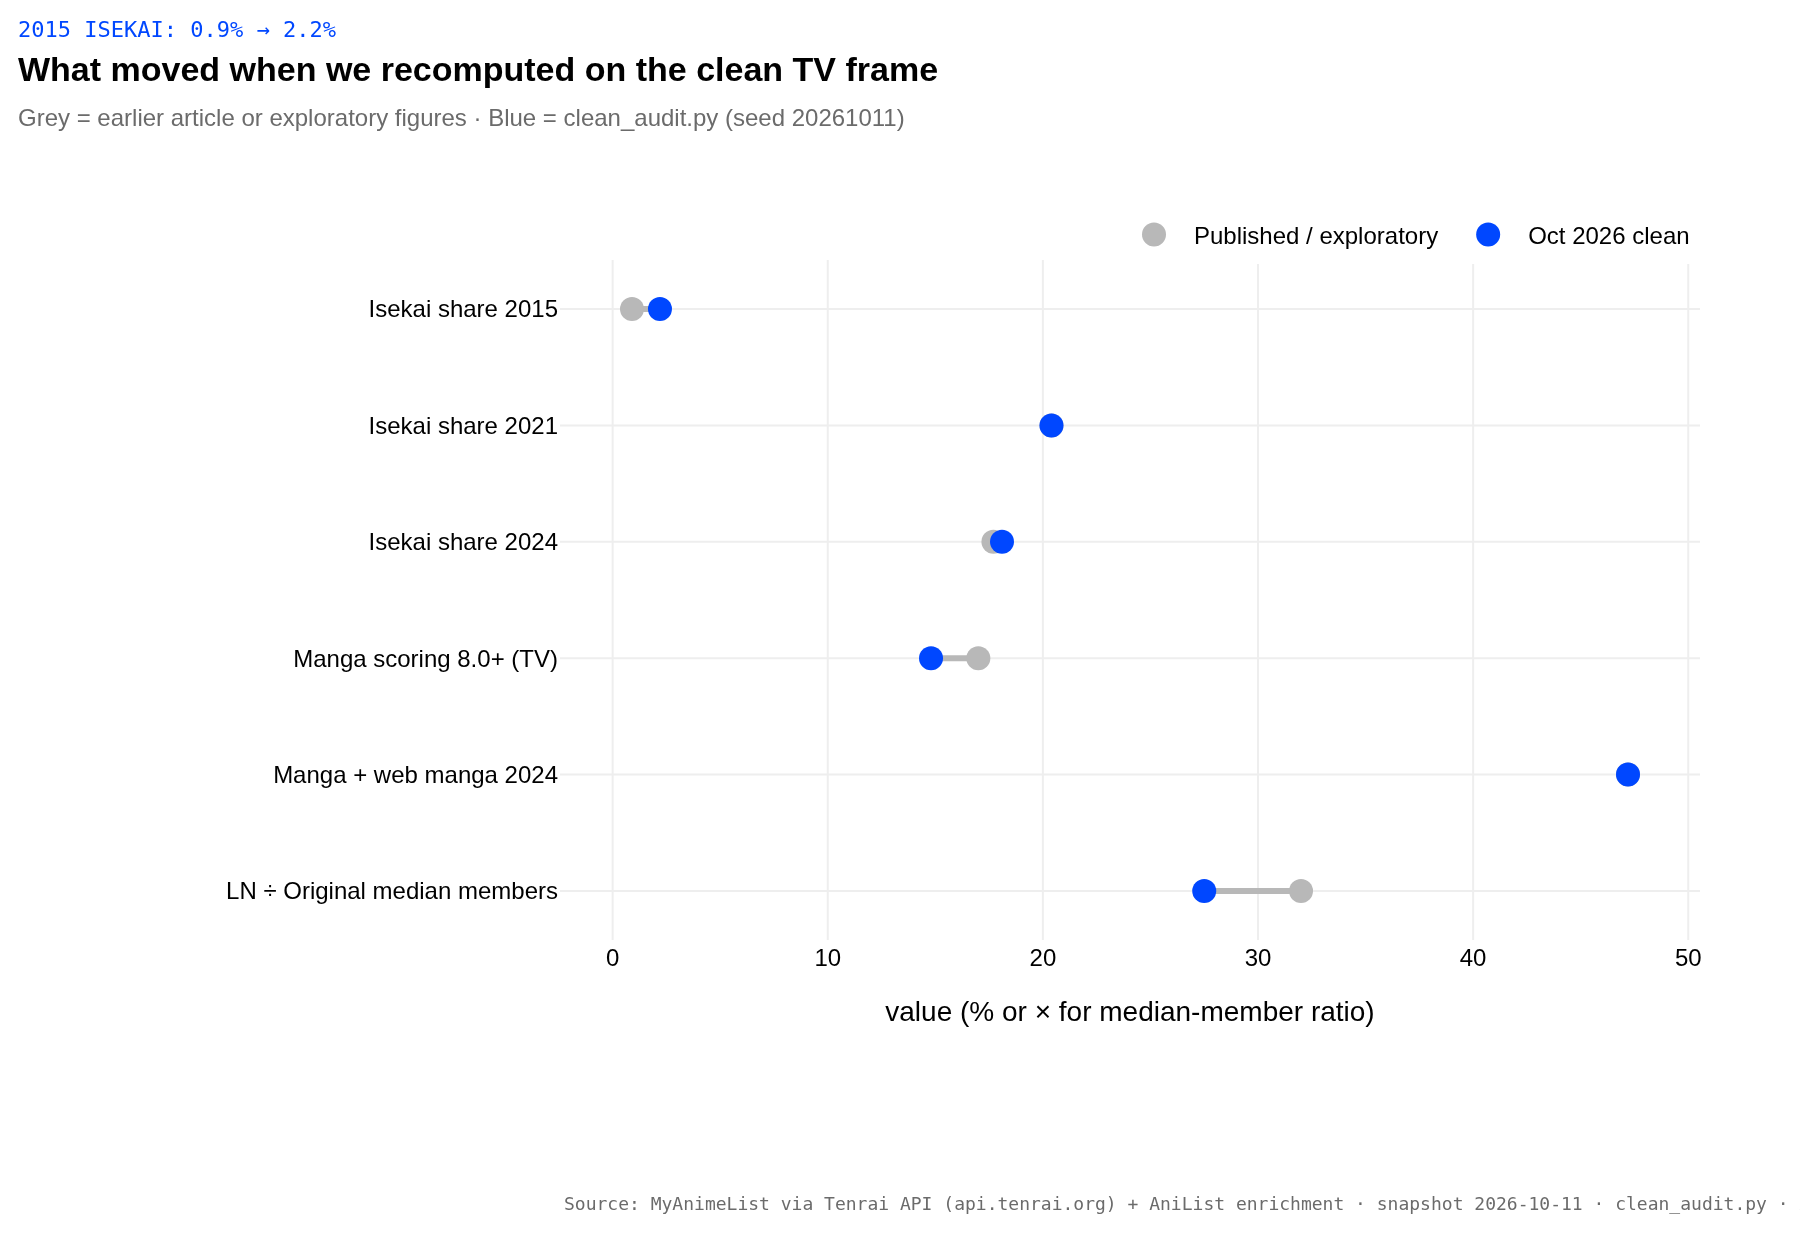
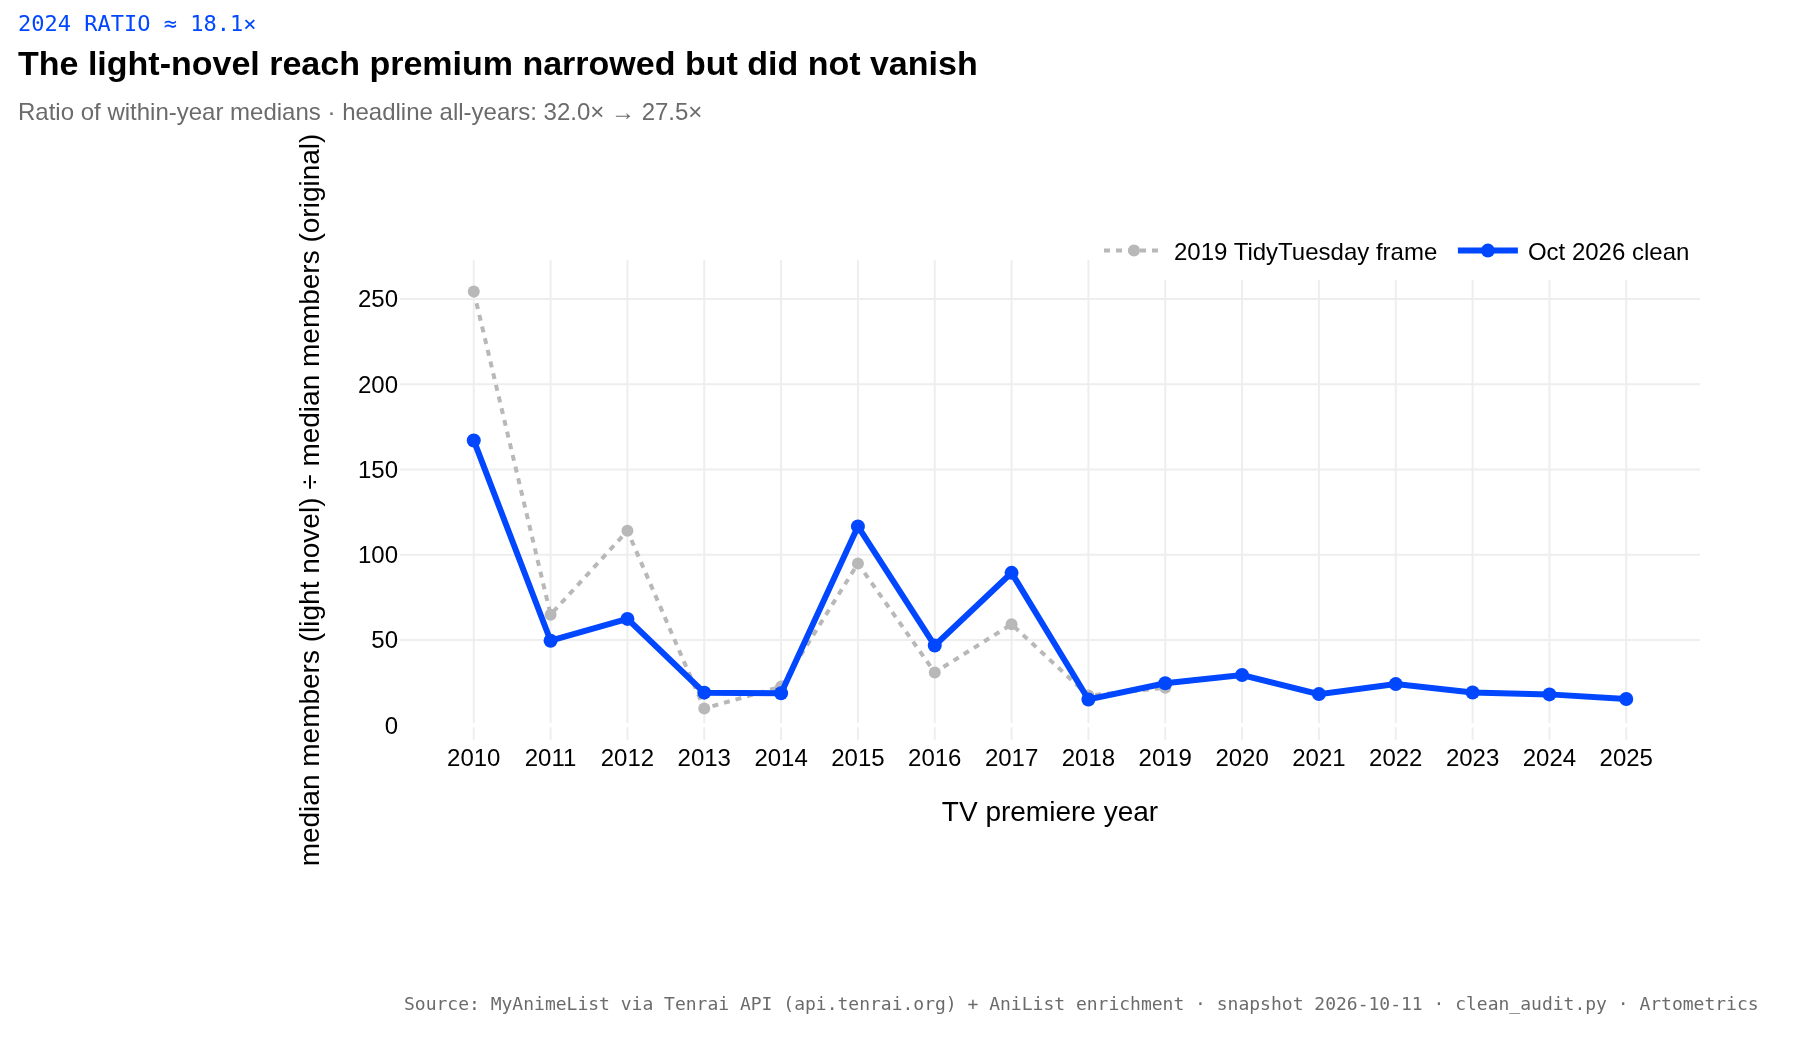
Executive summary. The ANIME report's core story survives on the October 2026 ledger: source material still sets the audience floor, and isekai tags trace a real production wave. What changed is measurement. When MyAnimeList's public Jikan mirror shut down on 2026-10-01, we finished the refresh through Tenrai (api.tenrai.org, Jikan-compatible) and recomputed every headline on anime_2026-10-11_clean with one script. The light-novel reach multiple narrows from 32.0× to 27.5×. Manga's high-score share falls from 17.0% to 14.8%. The 2015 isekai point was an under-tag in the old exploratory frame (0.9% → 2.2%); 2021 stays 20.4% and 2024 edges to 18.1%. Single-year shares are trends, not precise point estimates — bootstrap ranges are about ±5 percentage points.
WHY WE REFRESHED
The published report rested on the TidyTuesday export of 2019-04-23 (13,631 unique titles). A parallel pipeline had already grown the catalog to 18,818 rows with AniList tags, streaming links, and season fields. On 2026-10-01, MyAnimeList discontinued the free Jikan v4 API (api.jikan.moe). We completed metadata fetches through Tenrai, which mirrors the same Jikan field schema, then ran scripts/anime-data/clean_audit.py (seed 20261011) to produce anime_2026-10-11_clean.* with documented inclusion rules and bootstrap ranges.
OLD VS NEW
Published / exploratory is what readers saw before this audit. Clean new is the October 2026 TV frame from the clean file; brackets are 95% bootstrap ranges where shown.
| Figure (TV unless noted) | Published | Clean new (Oct 2026) | Why it moved |
|---|---|---|---|
| Rows in catalog | 13,631 (2019 snapshot) | 18,813 clean | +5,187 new MAL ids; scores and members updated to October 2026. |
| LN ÷ Original median members | 32.0× | 27.5× | 2026 member counts on a wider TV catalog; originals grew slightly faster at the median. |
| Manga share scoring 8.0+ | 17.0% | 14.8% | More manga TV titles in the denominator; scores drifted over seven years. |
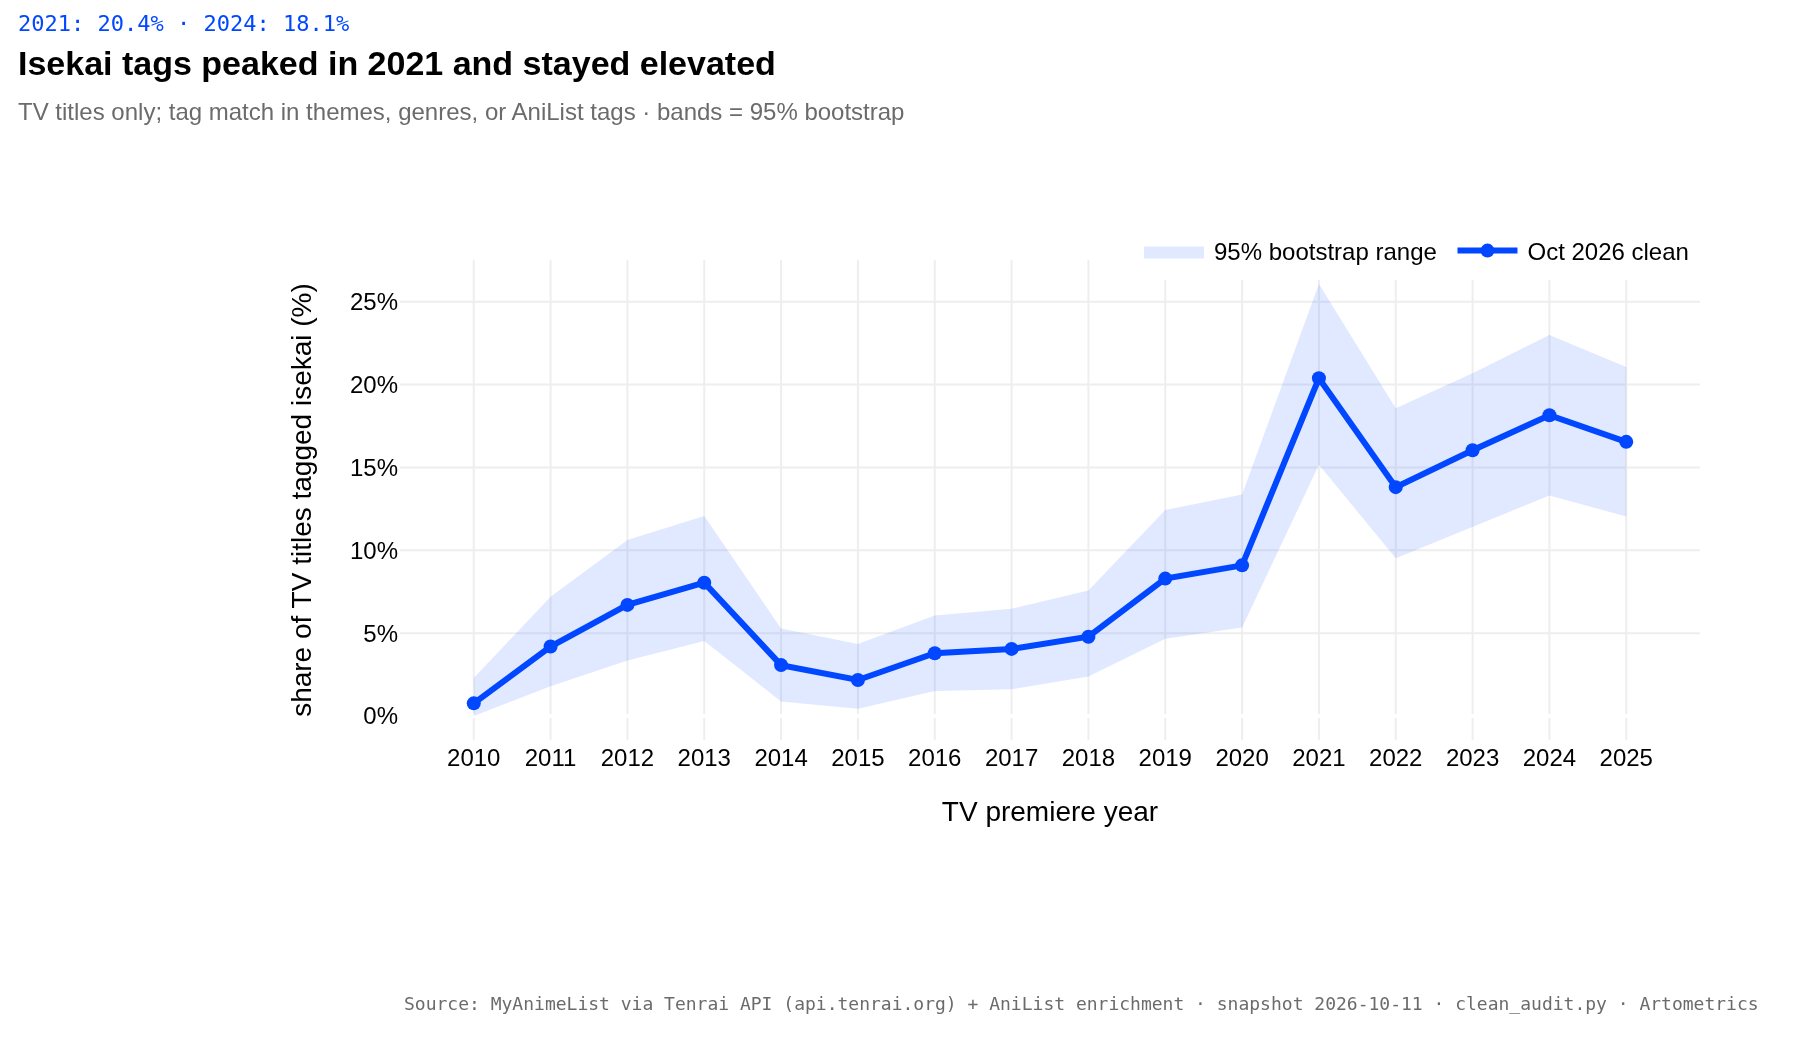
| Isekai share, 2015 premieres | 0.9% | 2.2% [0.4%–4.3%] (n=230) | Explicit tag rule across MAL themes and AniList tags; old figure used a thinner tag field. |
| Isekai share, 2021 premieres | 20.4% | 20.4% [15.2%–25.6%] (n=211) | Stable under the new rule — the wave peak still lands here. |
| Isekai share, 2024 premieres | 17.7% | 18.1% [13.7%–23.0%] (n=248) | Within uncertainty; read as elevated vs pre-2018, not a precise YoY tick. |
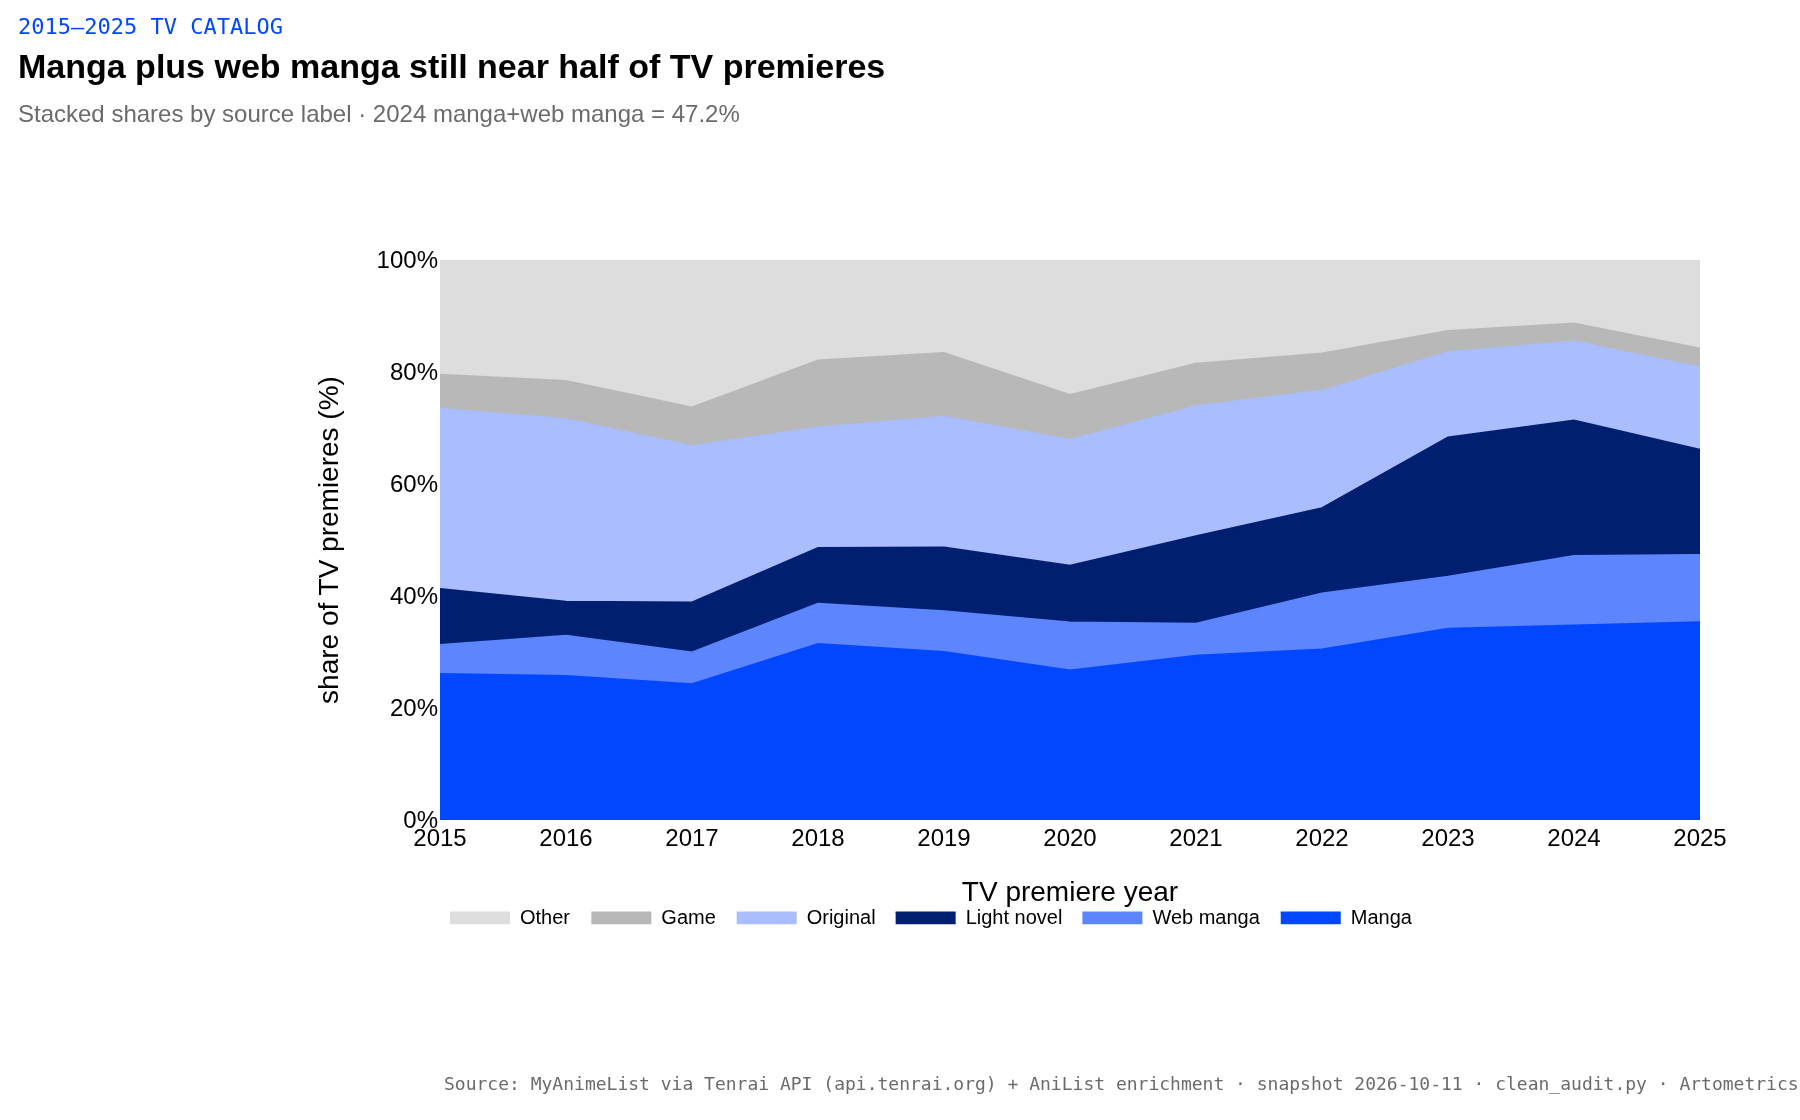
| Manga + web manga, 2024 premieres | 47.2% | 47.2% [41.1%–53.2%] (n=248) | Unchanged point estimate; web manga share still ~12.5%. |
| Tenrai fetch failures | — | 156 rows flagged | Retained with flag_unfetched_jikan; sensitivity shows no material shift for isekai 2024. |
WHAT WE CHECKED
We drew n = 200 rows with both Tenrai/Jikan and AniList fields present (seed 20261011). Score agreement within 0.5 points on the MAL 0–10 scale (|MAL − AniList meanScore/10| ≤ 0.5): 146 / 200 = 73%. This is an offline check of already-joined fields — not a live re-fetch at audit time. Year agreement between aired_from_year and season_year was weaker (59.5%), which is why calendar-year shares carry wide bootstrap bands.
Cleaning removed 5 rows missing id/name, normalized source labels, and nulled five end-before-start dates. No scores were imputed. Full PRISMA counts and rules R1–R7 are in data/anime/CLEANING_LOG.md.
HOW TO READ SINGLE-YEAR SHARES
For any one premiere year, the 95% bootstrap interval is typically about ±5 percentage points around the point estimate. That is wide enough that 17.7% vs 18.1% for 2024 isekai should be read as still elevated after the 2021 peak, not as proof of a 0.4-point decline. The charts in the main report show the full 2010–2025 trend lines and stacked source mix instead of over-interpreting one year.
LIMITATIONS
MyAnimeList popularity is not a probability sample. Tenrai is a mirror — 156 unfetched ids remain thin. AniList tags can label isekai more densely than MAL themes. Bootstrap intervals ignore studio clustering. Scores and members drift; October 2026 values are not a panel continuation of 2019 scores without modeling. The long-form ANIME video and some studio tables still describe the 2019 deduplicated file until a later pass; headline source and isekai figures in the report body now match this clean ledger.
METHOD NOTES
One entry point rebuilds the audit artifacts: python3 scripts/anime-data/clean_audit.py. Charts: python3 articles/anime/scripts/build_2026_charts.py. Dictionary and academic note: data/anime/DATA_DICTIONARY.md, data/anime/METHODS_NOTE.md. Sources: TidyTuesday 2019-04-23 baseline; Tenrai API accessed 2026-10-12; AniList GraphQL via idMal. Seed 20261011; bootstrap B = 2000.
EDITOR'S NOTE
Part of our corrections series: we publish what changed, and why, whenever we fix a dataset. See also FRANCHISE: What changed when we fixed the data. Human editorial direction; AI-assisted analysis per Artometrics workflow.
— Artometrics Editorial Desk