Pixar is the rare studio brand that became a quality guarantee — but guarantees are measurable. This report joins the TidyTuesday 2025-03-11 Pixar films release with its public_response companion file: 27 theatrical features, 24 with critic and audience scores attached.
Five charts, five angles on the same question: did Pixar's films get longer, softer, or harder to love as the catalog grew? The answers are longer, still crowd-pleasing, and critic-dependent at the margins.
FAST FACTS
DATASET CONTEXT
The core file pixar_films.csv lists theatrical features with release date, runtime, and MPAA rating. The companion public_response.csv adds Rotten Tomatoes, Metacritic, CinemaScore, and Critics' Choice scores. Three recent releases lack complete reception fields in the public file — treat absent values as missing data, not zero-quality signals.
This is not box-office data. The TidyTuesday readme points to a separate box_office extract in the {pixarfilms} R package for revenue analysis. Reception and runtime are the focus here because they are complete in-repo.
Reader path: if you are new to the topic, treat each chart as a guided tour of one question: who leads, how concentrated the field is, what changes over time, and where the outliers sit. If you already know the domain, use the same charts as a challenge: check whether the metric is the right proxy, whether the source omits an important population, and whether the headline survives the limitations section.
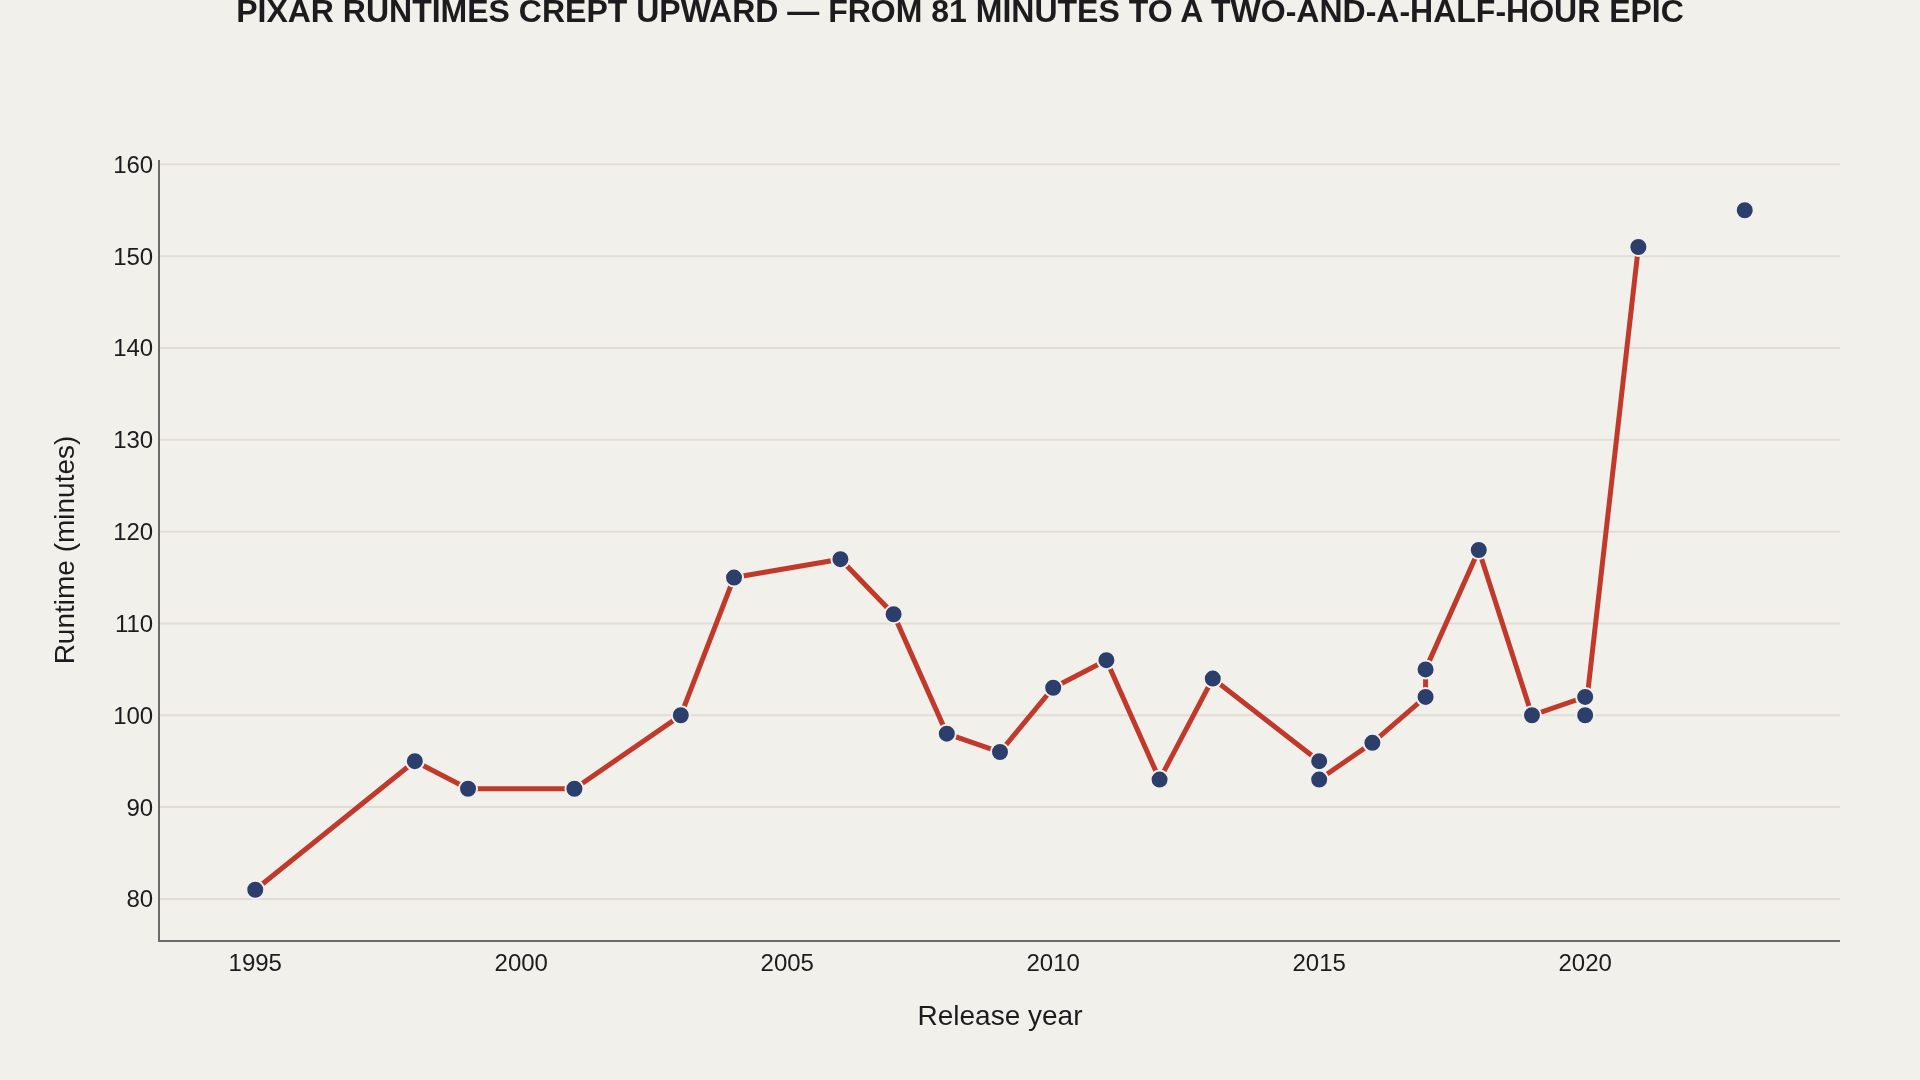
CHART 1 — RUNTIME CREEP
Pixar's theatrical releases did not stay the compact 81-minute package of Toy Story. Median runtime climbed from the sub-100-minute era of the late 1990s to a post-Incredibles 2 world where **nan** runs **155 minutes** — the longest entry in the canon.
The early median cluster around **98 minutes** (through 2006) versus **116 minutes** for films since 2017 is not noise. It is a structural shift in what a Pixar theatrical release is allowed to be.
CHART 2 — CRITIC SCORES
The median Rotten Tomatoes score across rated films is **96%** — elite by any studio standard. Pixar built a reputation on critic-proof consistency, not occasional brilliance.
The floor matters too. **Cars 2** sits at **40%**, while **Toy Story** and several sequels hit **100%**. The spread is narrow by Hollywood standards, but the low end is not random — it clusters around mid-2000s franchise experiments and the 2020s IP-forward releases.
CHART 3 — AUDIENCE VS CRITICS
CinemaScore grades cluster at **A** and **A+** across the board. Audiences who showed up opening weekend were rarely disappointed — or at least rarely admitted it on exit polls.
Critics were the discriminating layer. The same films that earned A+ crowd grades still span a 74–100% Rotten Tomatoes range. That gap is the story: Pixar optimized for mass affection first, prestige second.
CHART 4 — RATING MIX
**13** films carry a **G** rating; **10** are **PG**. The brand's family positioning is not marketing copy — it is embedded in the rating structure.
Only **0** titles in this file carry **PG-13**, and they arrive in the later era. Pixar expanded runtime and thematic weight without abandoning the all-ages lane until absolutely necessary.
SUPPLEMENT — RUNTIME VS RECEPTION
There is no simple rule that longer films score worse — Up, Wall-E, and Inside Out combine runtime north of **95 minutes** with scores above **95%**.
The outliers sit in the lower-right and upper-left: Cars 2 (shorter, weaker RT) versus epics that tested patience and still won. Bubble size tracks Metacritic where available — the reception stack is consistent across review systems.
LIMITATIONS
Reception scores are snapshots from Wikipedia-curated tables, not live API pulls. Rotten Tomatoes percentages can shift as reviews are added. CinemaScore is ordinal, not interval — treat cross-film comparisons as directional.
The dataset ends with the films included in the March 2025 TidyTuesday release. It does not include Disney+ exclusives or shorts. Runtime and rating analysis covers theatrical features only.
CONCLUSION
Pixar's measurable story is stability with drift: critics stayed harsh at the margins, audiences stayed generous, and runtimes marched upward. The brand did not break — it stretched.
That is the Artometrics read: the myth is magic; the data is a studio learning it could ask for more minutes, more sequels, and still keep the crowd on its side.
REFERENCES
Data Science Learning Community. (2025). TidyTuesday: Pixar Films. pixar_films.csv; public_response.csv. Original pixarfilms R package by Eric Leung.
EDITOR'S NOTE
This report replaces the initial batch-generated Pixar draft with a hand-tuned analysis joining both TidyTuesday files. Charts use Artometrics styling and Plotly JSON exports.